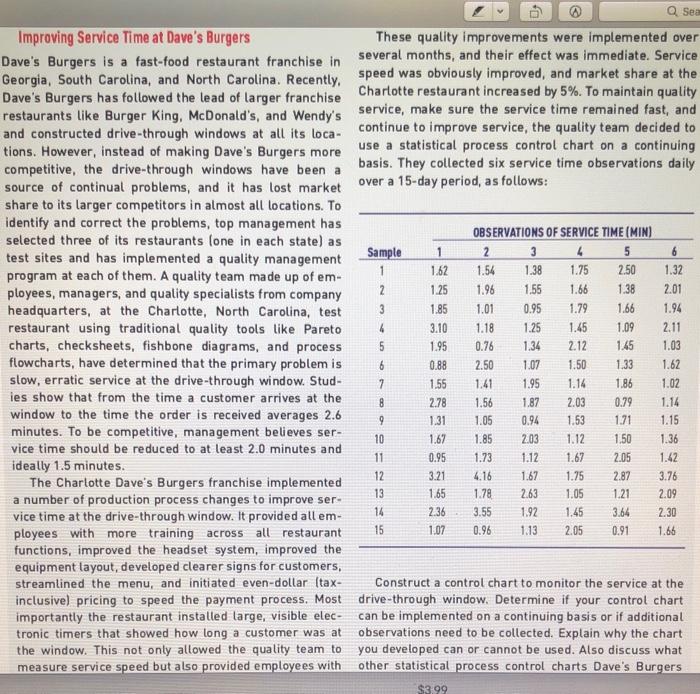
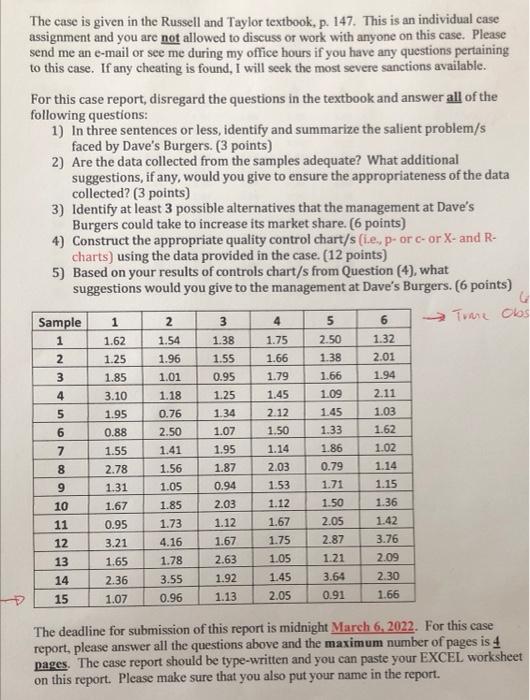
1 2 3 4 5 6 1.75 2 3 1.01 4 Q Sea Improving Service Time at Dave's Burgers These quality improvements were implemented over Dave's Burgers is a fast-food restaurant franchise in several months, and their effect was immediate. Service Georgia, South Carolina, and North Carolina. Recently, speed was obviously improved, and market share at the Dave's Burgers has followed the lead of larger franchise Charlotte restaurant increased by 5%. To maintain quality restaurants like Burger King, McDonald's, and Wendy's service, make sure the service time remained fast, and and constructed drive-through windows at all its loca continue to improve service, the quality team decided to tions. However, instead of making Dave's Burgers more use a statistical process control chart on a continuing competitive, the drive-through windows have been a basis. They collected six service time observations daily source of continual problems, and it has lost market over a 15-day period, as follows: share to its larger competitors in almost all locations. To identify and correct the problems, top management has selected three of its restaurants (one in each state) as OBSERVATIONS OF SERVICE TIME (MIN) test sites and has implemented a quality management Sample program at each of them. A quality team made up of em- 1 1.62 1.54 1.38 2.50 1.32 ployees, managers, and quality specialists from company 1.25 1.96 1,55 1.66 1.38 2.01 headquarters, at the Charlotte, North Carolina, test 1.85 0.95 1.79 1.66 1.94 restaurant using traditional quality tools like Pareto 3.10 1.18 1.25 1.45 1.09 2.11 charts, checksheets, fishbone diagrams, and process 5 1.95 0.76 1.34 2.12 1.45 1.03 flowcharts, have determined that the primary problem is 0.88 1.07 1.50 1.33 1.62 slow, erratic service at the drive-through window. Stud- 1.55 1.14 1.86 1.02 ies show that from the time a customer arrives at the 8 278 1.56 1.87 2.03 0.79 window to the time the order is received averages 2.6 1.05 0.94 1.53 171 1.15 minutes. To be competitive, management believes ser- 1.67 1.85 1.12 1.50 vice time should be reduced to at least 2.0 minutes and 1.73 ideally 1.5 minutes. 1.12 1.67 2.05 1.42 12 The Charlotte Dave's Burgers franchise implemented 1.75 i number of production process changes to improve ser- 13 1.65 1.78 2.09 vice time at the drive-through window. It provided allem- 3.55 1.92 1.45 3.66 2.30 ployees with more training across all restaurant 2.05 0.91 functions, improved the headset system, improved the equipment layout, developed clearer signs for customers, streamlined the menu, and initiated even-dollar (tax- Construct a control chart to monitor the service at the inclusivel pricing to speed the payment process. Most drive-through window. Determine if your control chart importantly the restaurant installed large, visible elec- can be implemented on a continuing basis or if additional tronic timers that showed how long a customer was at observations need to be collected. Explain why the chart the window. This not only allowed the quality team to you developed can or cannot be used. Also discuss what measure service speed but also provided employees with other statistical process control charts Dave's Burgers 6 2.50 7 1.41 1.95 1.14 1.31 9 10 2.03 1.36 11 0.95 3.21 4.16 3.76 1.67 2.63 2.87 1.21 1.05 14 15 2.36 1.07 0.96 1.13 1.66 $3.99 The case is given in the Russell and Taylor textbook, p. 147. This is an individual case assignment and you are not allowed to discuss or work with anyone on this case. Please send me an e-mail or see me during my office hours if you have any questions pertaining to this case. If any cheating is found, I will seek the most severe sanctions available. For this case report, disregard the questions in the textbook and answer all of the following questions: 1) In three sentences or less, identify and summarize the salient problem/s faced by Dave's Burgers. (3 points) 2) Are the data collected from the samples adequate? What additional suggestions, if any, would you give to ensure the appropriateness of the data collected? (3 points) 3) Identify at least 3 possible alternatives that the management at Dave's Burgers could take to increase its market share. (6 points) 4) Construct the appropriate quality control chart/s (i.e., p-or c-or X- and R. charts) using the data provided in the case. (12 points) 5) Based on your results of controls chart/s from Question (4), what suggestions would you give to the management at Dave's Burgers. (6 points) Sample 1 2 5 Tuane Obs 1.62 1.54 1.38 1.75 2.50 1.32 2 1.25 1.96 1.55 1.66 1.38 2.01 3 1.85 1.01 0.95 1.79 1.66 1.94 4 3.10 1.18 1.25 1.45 1.09 2.11 5 1.95 0.76 2.12 1.45 1.03 6 0.88 2.50 1.07 1.50 1.33 1.62 7 1.55 1.41 1.95 1.86 1.02 8 2.78 1.56 1.87 2.03 0.79 1.14 9 1.05 0.94 1.71 1.15 10 1.67 1.85 2.03 1.12 1.50 1.36 11 0.95 1.73 1.12 1.67 2.05 1.42 12 3.21 4.16 1.67 1.75 2.87 3.76 13 1.65 1.78 2.63 1.05 2.09 14 2.36 3.55 1.92 1.45 3.64 2.30 15 1.07 0.96 1.13 2.05 0.91 1.66 3 4 6 1 HIN 1.34 1.14 1.31 1.53 1.21 The deadline for submission of this report is midnight March 6, 2022. For this case report, please answer all the questions above and the maximum number of pages is 4 pages. The case report should be type-written and you can paste your EXCEL worksheet on this report. Please make sure that you also put your name in the report