

Question: Case: A small convenience store chain is interested in modeling the weekly sales of a store, y, as a function of the weekly traffic flow
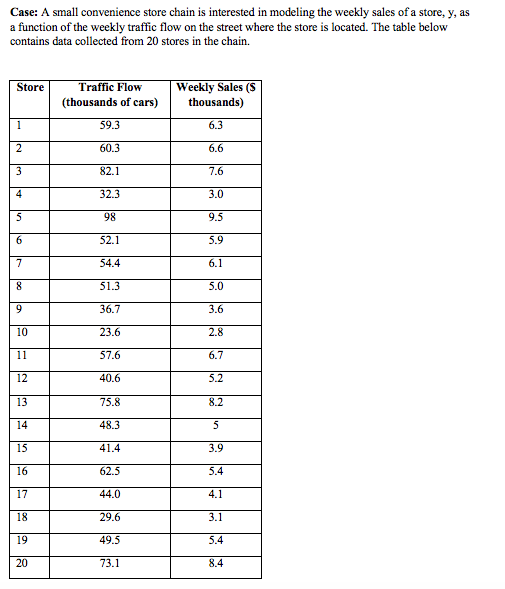
Case: A small convenience store chain is interested in modeling the weekly sales of a store, y, as a function of the weekly traffic flow on the street where the store is located. The table below contains data collected from 20 stores in the chain. Store Traffic Flow Weekly Sales (S (thousands of cars) thousands) 59.3 6.3 2 60.3 6.6 3 82.1 7.6 32.3 3.0 5 98 9.5 6 52.1 5.9 54.4 6.1 51.3 5.0 36.7 3.6 23.6 2.8 11 57.6 6.7 12 40.6 5.2 13 75.8 8.2 14 48.3 5 15 41.4 3.9 16 62.5 5.4 17 44.0 4.1 18 29.6 3.1 19 49.5 5.4 20 73.1 8.4
Step by Step Solution
There are 3 Steps involved in it
1 Expert Approved Answer
Step: 1 Unlock

Question Has Been Solved by an Expert!
Get step-by-step solutions from verified subject matter experts
Step: 2 Unlock
Step: 3 Unlock