Question: Case analysis and Operations 1. Develop a service flow chart for Kazu and identify the bottleneck resource. In addition to reading the narrative in the
Case analysis and Operations
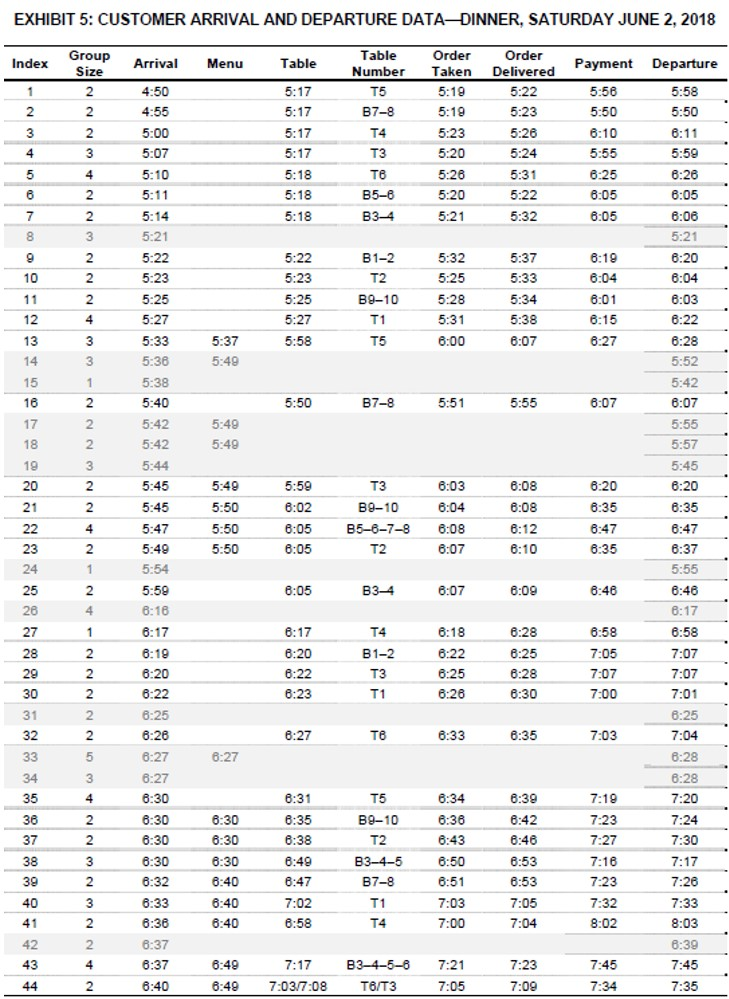
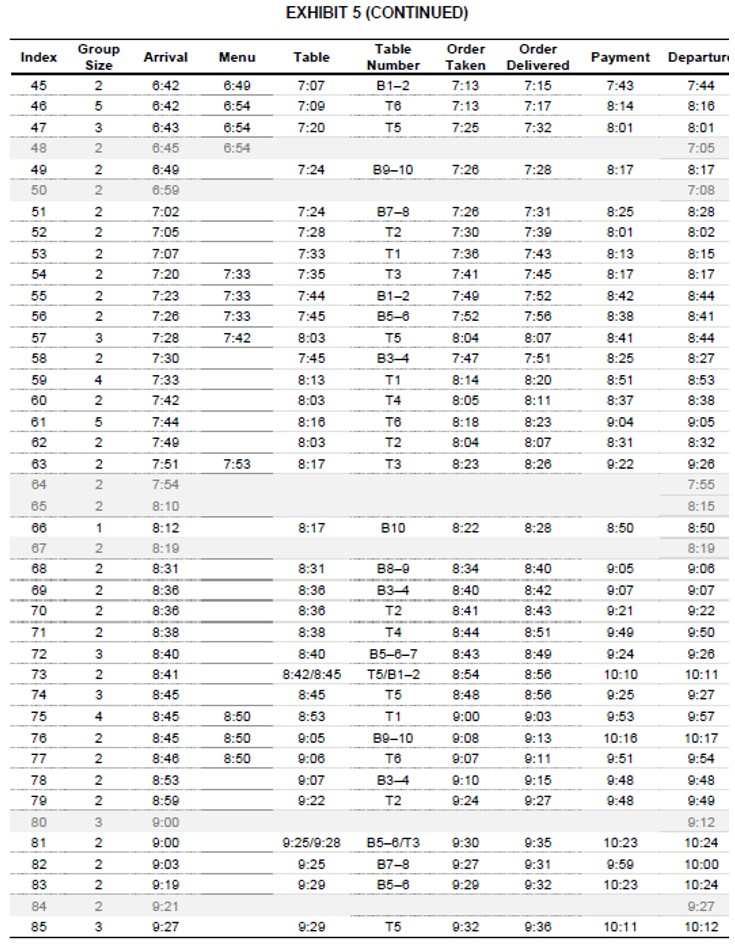
1. Develop a service flow chart for Kazu and identify the bottleneck resource. In addition to reading the narrative in the case, you need to use the information and data in Exhibit 5 to answer this question. No need for using all the data, but use enough to estimate averages for time taken by servers, chefs, check-out clerks et al.
2. Propose service metrics for measuring the efficiency and performance of the restaurant. List both the merits and the areas that you think deserve further scrutiny
3. Do the missed customers pose a major concern to Kazu? To what extent can the restaurant retain these customers and how would they do that? What mechanisms could they use?
Extra Credit: Discuss the issue with quantitative reasoning.
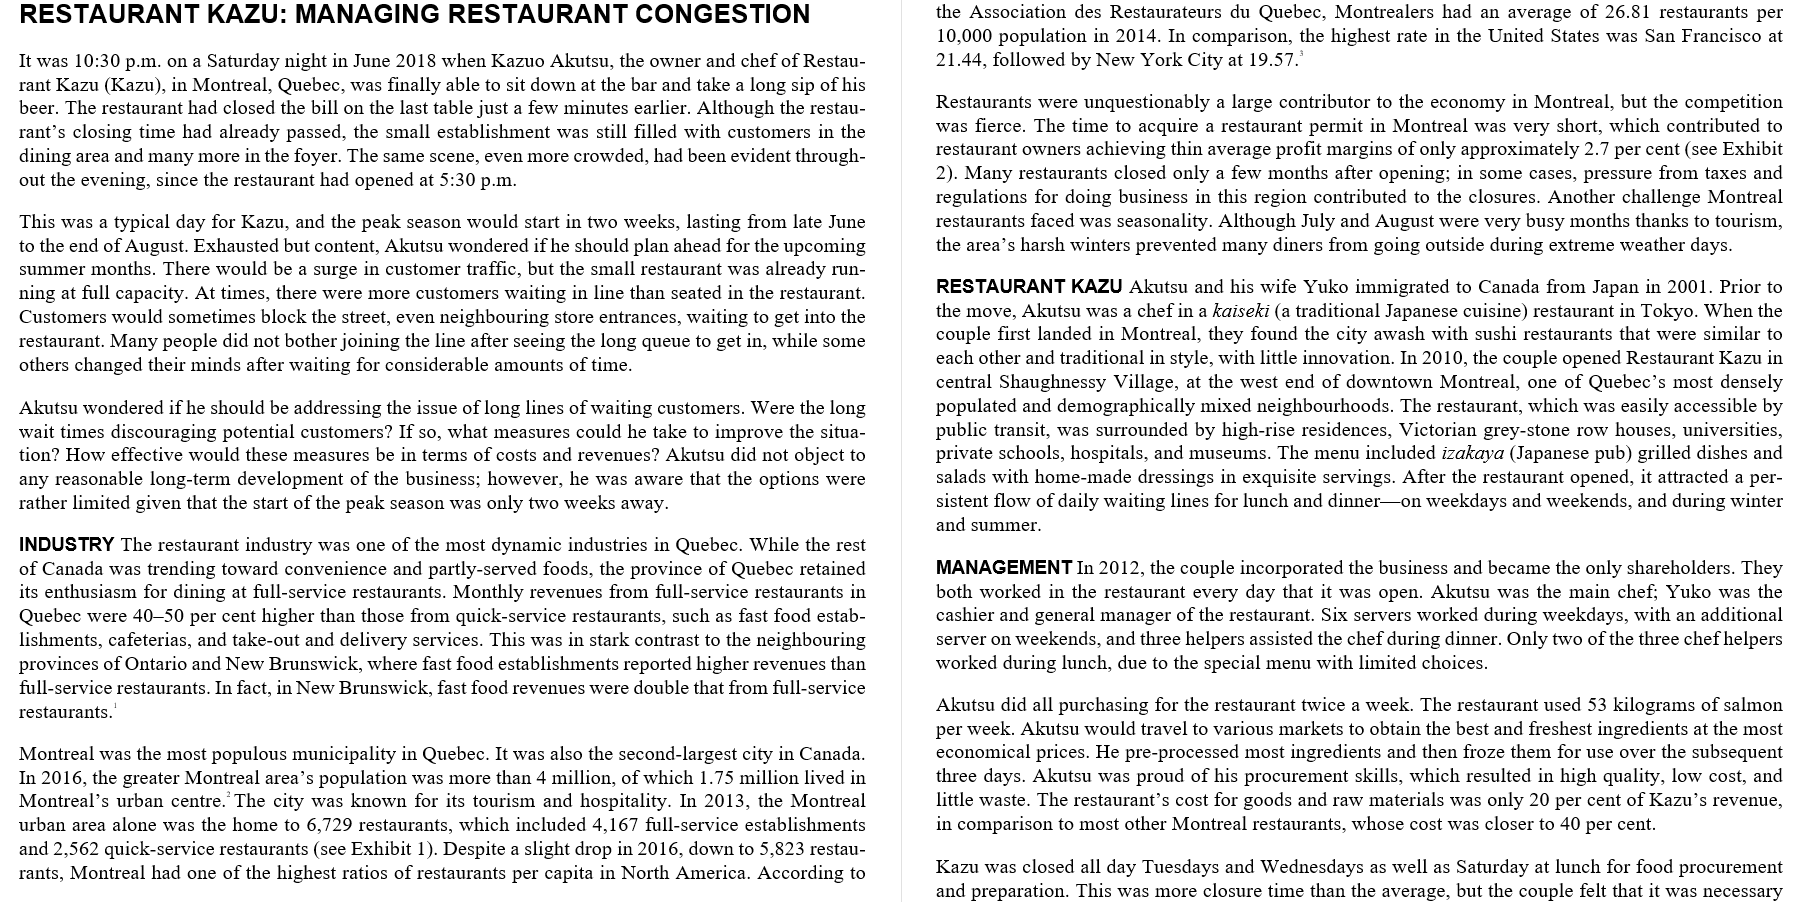
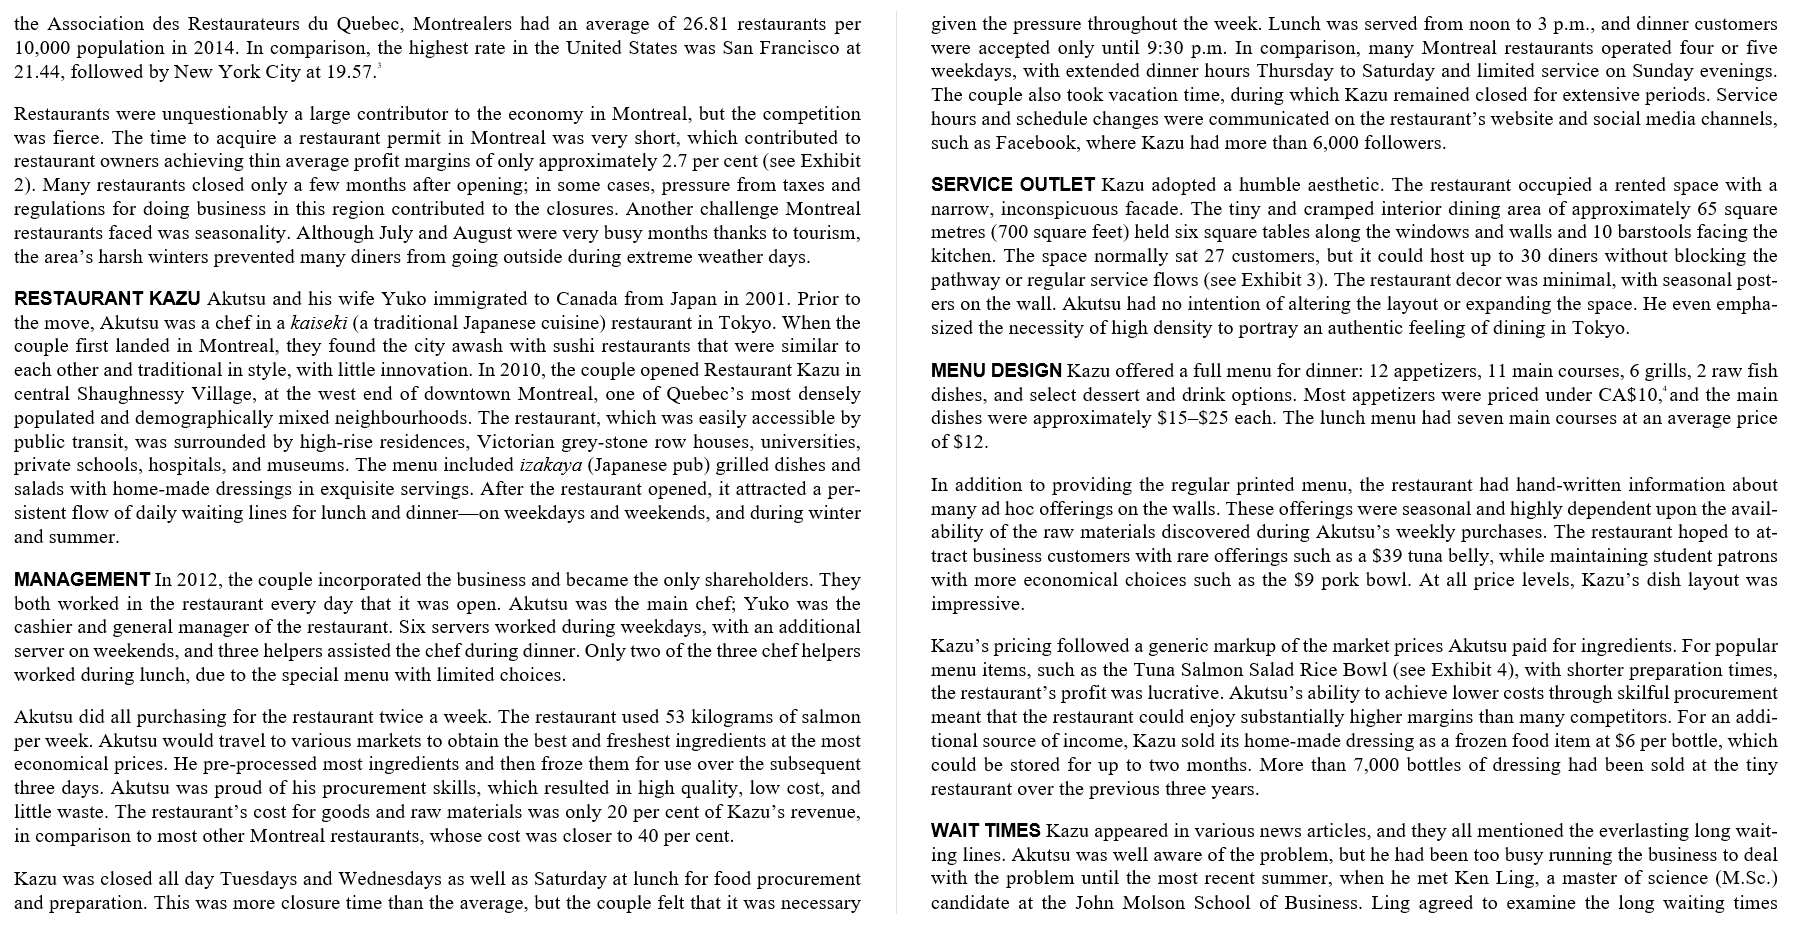
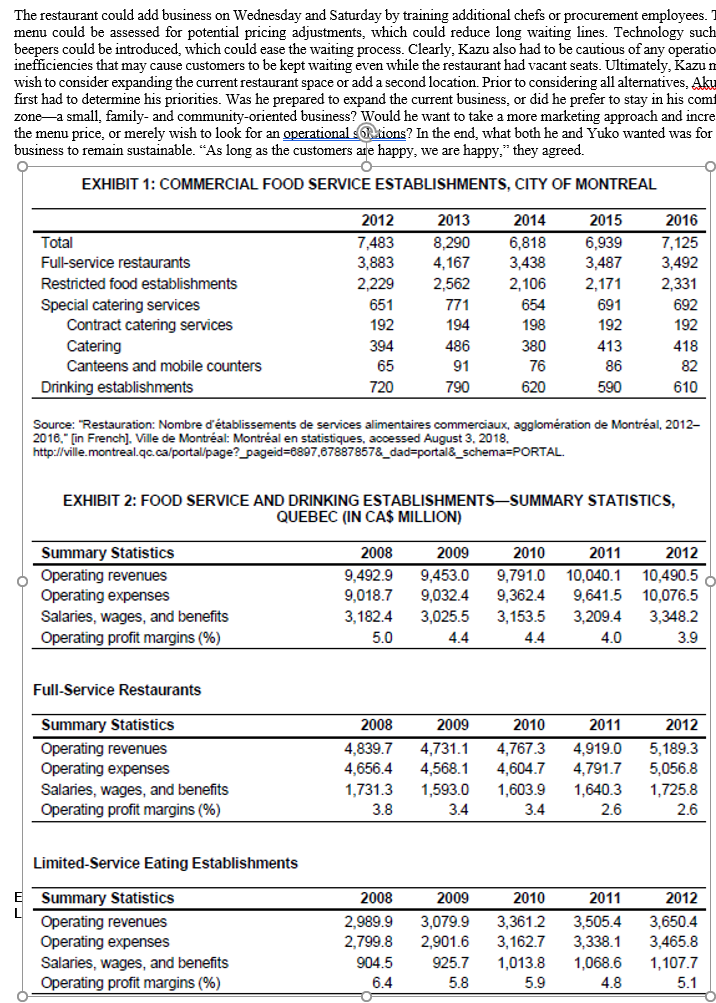
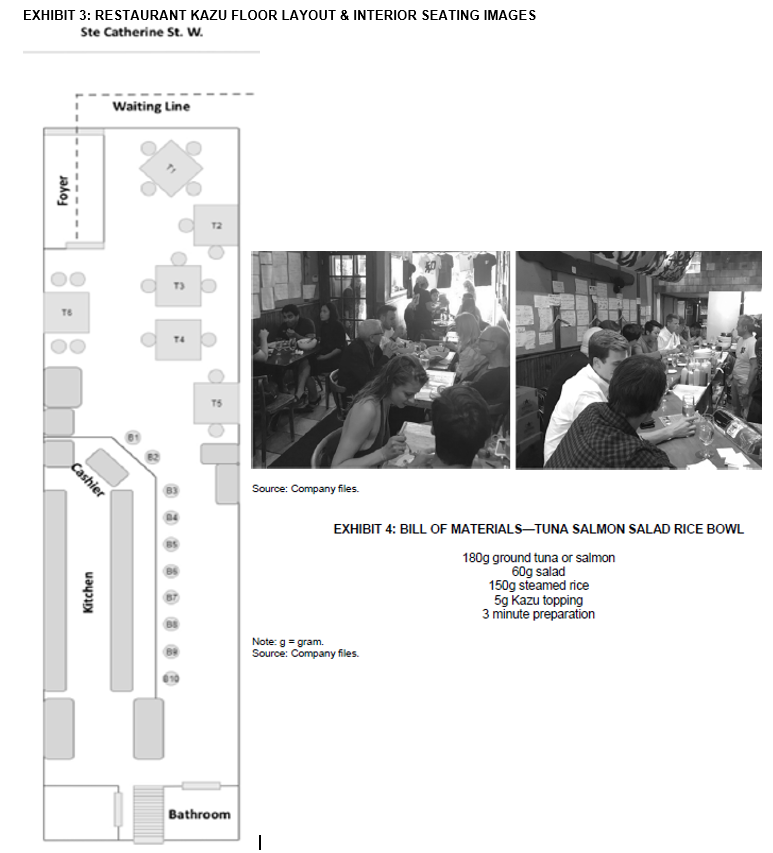
RESTAURANT KAZU: MANAGING RESTAURANT CONGESTION the Association des Restaurateurs du Quebec, Montrealers had an average of 26.81 restaurants per 10,000 population in 2014. In comparison, the highest rate in the United States was San Francisco at 21.44, followed by New York City at 19.57. It was 10:30 p.m. on a Saturday night in June 2018 when Kazuo Akutsu, the owner and chef of Restau- rant Kazu (Kazu), in Montreal, Quebec, was finally able to sit down at the bar and take a long sip of his beer. The restaurant had closed the bill on the last table just a few minutes earlier. Although the restau- rant's closing time had already passed, the small establishment was still filled with customers in the dining area and many more in the foyer. The same scene, even more crowded, had been evident through- out the evening, since the restaurant had opened at 5:30 p.m. This was a typical day for Kazu, and the peak season would start in two weeks, lasting from late June to the end of August. Exhausted but content, Akutsu wondered if he should plan ahead for the upcoming summer months. There would be a surge in customer traffic, but the small restaurant was already run- ning at full capacity. At times, there were more customers waiting in line than seated in the restaurant. Customers would sometimes block the street, even neighbouring store entrances, waiting to get into the restaurant. Many people did not bother joining the line after seeing the long queue to get in, while some others changed their minds after waiting for considerable amounts of time. Restaurants were unquestionably a large contributor to the economy in Montreal, but the competition was fierce. The time to acquire a restaurant permit in Montreal was very short, which contributed to restaurant owners achieving thin average profit margins of only approximately 2.7 per cent (see Exhibit 2). Many restaurants closed only a few months after opening; in some cases, pressure from taxes and regulations for doing business in this region contributed to the closures. Another challenge Montreal restaurants faced was seasonality. Although July and August were very busy months thanks to tourism, the area's harsh winters prevented many diners from going outside during extreme weather days. RESTAURANT KAZU Akutsu and his wife Yuko immigrated to Canada from Japan in 2001. Prior to the move, Akutsu was a chef in a kaiseki (a traditional Japanese cuisine) restaurant in Tokyo. When the couple first landed in Montreal, they found the city awash with sushi restaurants that were similar to each other and traditional in style, with little innovation. In 2010, the couple opened Restaurant Kazu in central Shaughnessy Village, at the west end of downtown Montreal, one of Quebec's most densely populated and demographically mixed neighbourhoods. The restaurant, which was easily accessible by public transit, was surrounded by high-rise residences, Victorian grey-stone row houses, universities, private schools, hospitals, and museums. The menu included izakaya (Japanese pub) grilled dishes and salads with home-made dressings in exquisite servings. After the restaurant opened, it attracted a per- sistent flow of daily waiting lines for lunch and dinneron weekdays and weekends, and during winter and summer. Akutsu wondered if he should be addressing the issue of long lines of waiting customers. Were the long wait times discouraging potential customers? If so, what measures could he take to improve the situa- tion? How effective would these measures be in terms of costs and revenues? Akutsu did not object to any reasonable long-term development of the business; however, he was aware that the options were rather limited given that the start of the peak season was only two weeks away. INDUSTRY The restaurant industry was one of the most dynamic industries in Quebec. While the rest of Canada was trending toward convenience and partly-served foods, the province of Quebec retained its enthusiasm for dining at full-service restaurants. Monthly revenues from full-service restaurants in Quebec were 4050 per cent higher than those from quick-service restaurants, such as fast food estab- lishments, cafeterias, and take-out and delivery services. This was in stark contrast to the neighbouring provinces of Ontario and New Brunswick, where fast food establishments reported higher revenues than full-service restaurants. In fact, in New Brunswick, fast food revenues were double that from full-service restaurants. MANAGEMENT In 2012, the couple incorporated the business and became the only shareholders. They both worked in the restaurant every day that it was open. Akutsu was the main chef; Yuko was the cashier and general manager of the restaurant. Six servers worked during weekdays, with an additional server on weekends, and three helpers assisted the chef during dinner. Only two of the three chef helpers worked during lunch, due to the special menu with limited choices. Montreal was the most populous municipality in Quebec. It was also the second-largest city in Canada. In 2016, the greater Montreal area's population was more than 4 million, of which 1.75 million lived in Montreal's urban centre. The city was known for its tourism and hospitality. In 2013, the Montreal urban area alone was the home to 6,729 restaurants, which included 4,167 full-service establishments and 2,562 quick-service restaurants (see Exhibit 1). Despite a slight drop in 2016, down to 5,823 restau- rants, Montreal had one of the highest ratios of restaurants per capita in North America. According to Akutsu did all purchasing for the restaurant twice a week. The restaurant used 53 kilograms of salmon per week. Akutsu would travel to various markets to obtain the best and freshest ingredients at the most economical prices. He pre-processed most ingredients and then froze them for use over the subsequent three days. Akutsu was proud of his procurement skills, which resulted in high quality, low cost, and little waste. The restaurant's cost for goods and raw materials was only 20 per cent of Kazu's revenue, in comparison to most other Montreal restaurants, whose cost was closer to 40 per cent. Kazu was closed all day Tuesdays and Wednesdays as well as Saturday at lunch for food procurement and preparation. This was more closure time than the average, but the couple felt that it was necessary the Association des Restaurateurs du Quebec, Montrealers had an average of 26.81 restaurants per 10,000 population in 2014. In comparison, the highest rate in the United States was San Francisco at 21.44, followed by New York City at 19.57. given the pressure throughout the week. Lunch was served from noon to 3 p.m., and dinner customers were accepted only until 9:30 p.m. In comparison, many Montreal restaurants operated four or five weekdays, with extended dinner hours Thursday to Saturday and limited service on Sunday evenings. The couple also took vacation time, during which Kazu remained closed for extensive periods. Service hours and schedule changes were communicated on the restaurant's website and social media channels, such as Facebook, where Kazu had more than 6,000 followers. Restaurants were unquestionably a large contributor to the economy in Montreal, but the competition was fierce. The time to acquire a restaurant permit in Montreal was very short, which contributed to restaurant owners achieving thin average profit margins of only approximately 2.7 per cent (see Exhibit 2). Many restaurants closed only a few months after opening; in some cases, pressure from taxes and regulations for doing business in this region contributed to the closures. Another challenge Montreal restaurants faced was seasonality. Although July and August were very busy months thanks to tourism, the area's harsh winters prevented many diners from going outside during extreme weather days. SERVICE OUTLET Kazu adopted a humble aesthetic. The restaurant occupied a rented space with a narrow, inconspicuous facade. The tiny and cramped interior dining area of approximately 65 square metres (700 square feet) held six square tables along the windows and walls and 10 barstools facing the kitchen. The space normally sat 27 customers, but it could host up to 30 diners without blocking the pathway or regular service flows (see Exhibit 3). The restaurant decor was minimal, with seasonal post- ers on the wall. Akutsu had no intention of altering the layout or expanding the space. He even empha- sized the necessity of high density to portray an authentic feeling of dining in Tokyo. RESTAURANT KAZU Akutsu and his wife Yuko immigrated to Canada from Japan in 2001. Prior to the move, Akutsu was a chef in a kaiseki (a traditional Japanese cuisine) restaurant in Tokyo. When the couple first landed in Montreal, they found the city awash with sushi restaurants that were similar to each other and traditional in style, with little innovation. In 2010, the couple opened Restaurant Kazu in central Shaughnessy Village, at the west end of downtown Montreal, one of Quebec's most densely populated and demographically mixed neighbourhoods. The restaurant, which was easily accessible by public transit, was surrounded by high-rise residences, Victorian grey-stone row houses, universities, private schools, hospitals, and museums. The menu included izakaya (Japanese pub) grilled dishes and salads with home-made dressings in exquisite servings. After the restaurant opened, it attracted a per- sistent flow of daily waiting lines for lunch and dinneron weekdays and weekends, and during winter and summer. MENU DESIGN Kazu offered a full menu for dinner: 12 appetizers, 11 main courses, 6 grills, 2 raw fish dishes, and select dessert and drink options. Most appetizers were priced under CA$ 10, and the main dishes were approximately $15$25 each. The lunch menu had seven main courses at an average price of $12. In addition to providing the regular printed menu, the restaurant had hand-written information about many ad hoc offerings on the walls. These offerings were seasonal and highly dependent upon the avail- ability of the raw materials discovered during Akutsu's weekly purchases. The restaurant hoped to at- tract business customers with rare offerings such as a $39 tuna belly, while maintaining student patrons with more economical choices such as the $9 pork bowl. At all price levels, Kazu's dish layout was impressive. MANAGEMENT In 2012, the couple incorporated the business and became the only shareholders. They both worked in the restaurant every day that it was open. Akutsu was the main chef; Yuko was the cashier and general manager of the restaurant. Six servers worked during weekdays, with an additional server on weekends, and three helpers assisted the chef during dinner. Only two of the three chef helpers worked during lunch, due to the special menu with limited choices. Akutsu did all purchasing for the restaurant twice a week. The restaurant used 53 kilograms of salmon per week. Akutsu would travel to various markets to obtain the best and freshest ingredients at the most economical prices. He pre-processed most ingredients and then froze them for use over the subsequent three days. Akutsu was proud of his procurement skills, which resulted in high quality, low cost, and little waste. The restaurant's cost for goods and raw materials was only 20 per cent of Kazu's revenue, in comparison to most other Montreal restaurants, whose cost was closer to 40 per cent. Kazu's pricing followed a generic markup of the market prices Akutsu paid for ingredients. For popular menu items, such as the Tuna Salmon Salad Rice Bowl (see Exhibit 4), with shorter preparation times, the restaurant's profit was lucrative. Akutsu's ability to achieve lower costs through skilful procurement meant that the restaurant could enjoy substantially higher margins than many competitors. For an addi- tional source of income, Kazu sold its home-made dressing as a frozen food item at $6 per bottle, which could be stored for up to two months. More than 7,000 bottles of dressing had been sold at the tiny restaurant over the previous three years. Kazu was closed all day Tuesdays and Wednesdays as well as Saturday at lunch for food procurement and preparation. This was more closure time than the average, but the couple felt that it was necessary WAIT TIMES Kazu appeared in various news articles, and they all mentioned the everlasting long wait- ing lines. Akutsu was well aware of the problem, but he had been too busy running the business to deal with the problem until the most recent summer, when he met Ken Ling, a master of science (M.Sc.) candidate at the John Molson School of Business. Ling agreed to examine the long waiting times The restaurant could add business on Wednesday and Saturday by training additional chefs or procurement employees. I menu could be assessed for potential pricing adjustments, which could reduce long waiting lines. Technology such beepers could be introduced, which could ease the waiting process. Clearly, Kazu also had to be cautious of any operatio inefficiencies that may cause customers to be kept waiting even while the restaurant had vacant seats. Ultimately, Kazu wish to consider expanding the current restaurant space or add a second location. Prior to considering all alternatives. Aku first had to determine his priorities. Was he prepared to expand the current business, or did he prefer to stay in his com zonea small, family and community-oriented business? Would he want to take a more marketing approach and incre the menu price, or merely wish to look for an operational Ltions? In the end, what both he and Yuko wanted was for business to remain sustainable. As long as the customers are happy, we are happy," they agreed. EXHIBIT 1: COMMERCIAL FOOD SERVICE ESTABLISHMENTS, CITY OF MONTREAL Total Full-service restaurants Restricted food establishments Special catering services Contract catering services Catering Canteens and mobile counters Drinking establishments 2012 7,483 3,883 2,229 651 192 394 65 720 2013 8,290 4,167 2,562 771 194 486 91 790 2014 6,818 3,438 2,106 654 198 380 76 620 2015 6,939 3,487 2. 171 691 192 413 86 590 2016 7,125 3,492 2,331 692 192 418 82 610 Source: "Restauration: Nombre d'tablissements de services alimentaires commerciaux, agglomration de Montral, 2012- 2018." [in French). Ville de Montral: Montral en statistiques, accessed August 3, 2018, http://ville.montreal.qc.ca/portal/page?_pageid=8897,87887857&_dad=portal&_schema=PORTAL. EXHIBIT 2: FOOD SERVICE AND DRINKING ESTABLISHMENTS/SUMMARY STATISTICS, QUEBEC (IN CA$ MILLION) 2009 Summary Statistics Operating revenues Operating expenses Salaries, wages, and benefits Operating profit margins (%) 2008 9,492.9 9,018.7 3,182.4 5.0 9,453.0 9,032.4 3,025.5 4.4 2010 9,791.0 9,362.4 3,153.5 4.4 2011 10,040.1 9,641.5 3,209.4 4.0 2012 10,490.5 10,076.5 3,348.2 3.9 Full-Service Restaurants 2011 Summary Statistics Operating revenues Operating expenses Salaries, wages, and benefits Operating profit margins (%) 2008 4,839.7 4,656.4 1,731.3 3.8 2009 4,731.1 4,568.1 1,593.0 3.4 2010 4,767.3 4,604.7 1,603.9 3.4 4,919.0 4,791.7 1,640.3 2.6 2012 5,189.3 5,056.8 1,725.8 2.6 Limited-Service Eating Establishments E Summary Statistics Operating revenues Operating expenses Salaries, wages, and benefits Operating profit margins (%) 2008 2.989.9 2,799.8 904.5 6.4 2009 3,079.9 2,901.6 925.7 5.8 2010 3,3612 3,162.7 2011 3,505.4 3,338.1 1,068.6 4.8 2012 3,650.4 3,465.8 1,107.7 5.1 1,013.8 5.9 EXHIBIT 3: RESTAURANT KAZU FLOOR LAYOUT & INTERIOR SEATING IMAGES Ste Catherine St. W. Waiting Line Foyer TE T4 T5 Cashier Source: Company files. Kitchen EXHIBIT 4: BILL OF MATERIALSTUNA SALMON SALAD RICE BOWL 180g ground tuna or salmon 60g salad 150g steamed rice 5g Kazu topping 3 minute preparation Note: g = gram. Source: Company files Bathroom EXHIBIT 5: CUSTOMER ARRIVAL AND DEPARTURE DATA-DINNER, SATURDAY JUNE 2, 2018 Index Group Size Menu Table Payment Departure 2 5:17 5:17 5:17 5:17 N Order Taken 5:19 5:19 5:23 5:20 Table Numbe T5 B7-8 T4 T3 T6 B5-6 B3-4 Order Delivere 5:22 5:23 5:28 5:24 5:31 5:22 E. WN 5:56 5:50 6:10 5:55 6:25 8:05 4 on 4 2. 5:18 6:18 5:26 5:20 5:21 - 5:18 5:32 6:05 w N NN 5:22 5:23 WO00 Arrival 4:50 4:55 5:00 5:07 5:10 E. 5:11 5:14 5:21 5:22 5:23 5:25 5:27 5:33 5:36 5:38 5-40 5:42 5:42 5:44 5:45 5:45 5:47 5-49 B1-3 T2 B9-10 2 4 5:32 5:25 5:28 5:31 6:00 5:25 5:27 5:58 5:58 5:50 6:11 5:59 6:20 6:05 8:00 5:21 8:20 6:04 6:03 8:22 8:28 5:52 5:42 8:07 5:55 5:57 5:45 6:20 5:37 5:33 5:34 5:38 . 8:07 8:19 6:04 6:01 8:15 8-27 W 5:37 5:49 14 2 5:50 87-8 5:51 5:55 6:07 5:49 5:49 NNN 5:59 6:08 5:49 5:50 5:50 5:50 T3 B9-10 2 4 2 1 6:02 8:08 6:05 6:03 6:04 8:08 6:07 6:20 6:35 8:47 6:35 6:08 8:12 6:10 B5-8-7-8 T2 6:35 8:47 8:37 5:55 6:40 6:17 5:54 N 5:59 8:05 B3-4 6:07 6:09 6:46 6:18 6:58 NNN 6:16 6:17 8:19 6:20 6:22 6:17 6:20 es 6:22 8:23 T4 B1-2 T3 T1 6:22 6:25 6:26 8:28 6:25 6:28 8:30 7:05 7:07 7:00 2 2 2 2 5 8:27 8:33 8:35 7:03 6:27 6:25 6:26 6:27 6:27 8:30 6:30 6:58 7:07 7:07 7:01 6:24 7:04 8:28 8:28 7:20 7:24 7:30 7:17 za 7:20 3 8:31 6:35 NW N N + 8:30 6:30 6:30 6:38 6:49 1.47 6:47 TE B9-10 T2 B3-4-5 87-8 T1 T4 8:34 6:38 8:43 6:50 6:51 7:03 8:39 6:42 8:46 6:53 e. 6:53 7:19 7:23 7:27 7:16 7:23 7:32 8:02 6:30 6:32 6:33 6:36 6:37 6:37 6:40 3 8:40 8:40 8:40 7:02 6:58 7:05 7:04 7:00 N N 2 7:33 8:03 8:39 7:45 7:35 4 7:17 + 6:48 6:49 B3-4-5-6 T6/T3 7:21 7:05 22 N 7:03/7:08 EXHIBIT 5 (CONTINUED) Index Arrival Menu 45 46 47 Group Size 2 5 3 6:49 6:54 6:54 8:54 Table 7:07 7:09 7:20 Table Number B1-2 T5 Order Taken 7:13 7:13 7:25 Order Delivered 7:15 7:17 7:32 8:01 48 7:24 B9-10 7:26 7:28 49 50 51 52 53 54 7:33 7:33 7:33 7:42 N N N N N N N N N N N N N N N O on 55 56 57 58 59 60 61 62 63 64 65 7:24 7:28 7:33 7:35 7:44 7:45 8:03 7:45 8:13 8:03 8:16 8:03 8:17 B7-8 T2 T1 T3 B1-2 B5-6 T5 B3-4 T1 T4 T6 T2 7:26 7:30 7:36 7:41 7:49 7:52 8:04 7:47 8:14 8:05 8:18 8:04 8:23 7:31 7:39 7:43 7:45 7:52 7:56 8:07 7:51 8:20 8:11 8:23 8:07 8:26 4 2 5 7:53 T3 6:42 6:42 6:43 8:45 6:49 6:59 7:02 7:05 7:07 7:20 7:23 7:26 7:28 7:30 7:33 7:42 7:44 7:49 7:51 7:54 8:10 8:12 8:19 8:31 8:36 8:36 8:38 8:40 8:41 8:45 8:45 8:45 8:46 8:53 8:59 9:00 9:00 9:03 9:19 9:21 9:27 Payment Departur 7:43 7:44 8:14 8:16 8:01 7:05 8:17 8:17 7:08 8:25 8:28 8:01 8:02 8:13 8:15 8:17 8:17 8:42 8:44 8:38 8:41 8:41 8:44 8:25 8:27 8:51 8:53 8:37 8:38 9:04 9:05 8:31 8:32 9:22 9:26 7:55 8:15 8:50 8:50 8:19 9:05 9:06 9:07 9:07 9:21 9:22 9:49 9:50 9:24 9:26 10:10 10:11 9:25 9:27 9:53 9:57 10:16 10:17 9:51 9:54 9:48 9:48 9:48 9:49 9:12 10:23 10:24 9:59 10:00 10:23 10:24 9:27 10:11 10:12 66 1 8:17 810 8:22 8:28 67 68 69 70 NW N N N N N N 2 B8-9 B3-4 T2 T4 71 72 73 8:31 8:36 8:36 8:38 8:40 8:42/8:45 8:45 8:53 9:05 9:06 9:07 9:22 B5-6-7 T5/B1-2 T5 8:34 8:40 8:41 8:44 8:43 8:54 8:48 9:00 9:08 9:07 9:10 9:24 8:40 8:42 8:43 8:51 8:49 8:56 8:56 9:03 9:13 9:11 9:15 9:27 74 75 76 4 T1 8:50 8:50 8:50 2 2 B9-10 77 T6 B3-4 T2 78 79 80 81 82 83 84 2 3 2. 2 2 9:25/9:28 9:25 9:29 B5-6/T3 B7-8 B5-6 9:30 9:27 9:29 9:35 9:31 9:32 2 85 3 9:29 T5 9:32 9:36 RESTAURANT KAZU: MANAGING RESTAURANT CONGESTION the Association des Restaurateurs du Quebec, Montrealers had an average of 26.81 restaurants per 10,000 population in 2014. In comparison, the highest rate in the United States was San Francisco at 21.44, followed by New York City at 19.57. It was 10:30 p.m. on a Saturday night in June 2018 when Kazuo Akutsu, the owner and chef of Restau- rant Kazu (Kazu), in Montreal, Quebec, was finally able to sit down at the bar and take a long sip of his beer. The restaurant had closed the bill on the last table just a few minutes earlier. Although the restau- rant's closing time had already passed, the small establishment was still filled with customers in the dining area and many more in the foyer. The same scene, even more crowded, had been evident through- out the evening, since the restaurant had opened at 5:30 p.m. This was a typical day for Kazu, and the peak season would start in two weeks, lasting from late June to the end of August. Exhausted but content, Akutsu wondered if he should plan ahead for the upcoming summer months. There would be a surge in customer traffic, but the small restaurant was already run- ning at full capacity. At times, there were more customers waiting in line than seated in the restaurant. Customers would sometimes block the street, even neighbouring store entrances, waiting to get into the restaurant. Many people did not bother joining the line after seeing the long queue to get in, while some others changed their minds after waiting for considerable amounts of time. Restaurants were unquestionably a large contributor to the economy in Montreal, but the competition was fierce. The time to acquire a restaurant permit in Montreal was very short, which contributed to restaurant owners achieving thin average profit margins of only approximately 2.7 per cent (see Exhibit 2). Many restaurants closed only a few months after opening; in some cases, pressure from taxes and regulations for doing business in this region contributed to the closures. Another challenge Montreal restaurants faced was seasonality. Although July and August were very busy months thanks to tourism, the area's harsh winters prevented many diners from going outside during extreme weather days. RESTAURANT KAZU Akutsu and his wife Yuko immigrated to Canada from Japan in 2001. Prior to the move, Akutsu was a chef in a kaiseki (a traditional Japanese cuisine) restaurant in Tokyo. When the couple first landed in Montreal, they found the city awash with sushi restaurants that were similar to each other and traditional in style, with little innovation. In 2010, the couple opened Restaurant Kazu in central Shaughnessy Village, at the west end of downtown Montreal, one of Quebec's most densely populated and demographically mixed neighbourhoods. The restaurant, which was easily accessible by public transit, was surrounded by high-rise residences, Victorian grey-stone row houses, universities, private schools, hospitals, and museums. The menu included izakaya (Japanese pub) grilled dishes and salads with home-made dressings in exquisite servings. After the restaurant opened, it attracted a per- sistent flow of daily waiting lines for lunch and dinneron weekdays and weekends, and during winter and summer. Akutsu wondered if he should be addressing the issue of long lines of waiting customers. Were the long wait times discouraging potential customers? If so, what measures could he take to improve the situa- tion? How effective would these measures be in terms of costs and revenues? Akutsu did not object to any reasonable long-term development of the business; however, he was aware that the options were rather limited given that the start of the peak season was only two weeks away. INDUSTRY The restaurant industry was one of the most dynamic industries in Quebec. While the rest of Canada was trending toward convenience and partly-served foods, the province of Quebec retained its enthusiasm for dining at full-service restaurants. Monthly revenues from full-service restaurants in Quebec were 4050 per cent higher than those from quick-service restaurants, such as fast food estab- lishments, cafeterias, and take-out and delivery services. This was in stark contrast to the neighbouring provinces of Ontario and New Brunswick, where fast food establishments reported higher revenues than full-service restaurants. In fact, in New Brunswick, fast food revenues were double that from full-service restaurants. MANAGEMENT In 2012, the couple incorporated the business and became the only shareholders. They both worked in the restaurant every day that it was open. Akutsu was the main chef; Yuko was the cashier and general manager of the restaurant. Six servers worked during weekdays, with an additional server on weekends, and three helpers assisted the chef during dinner. Only two of the three chef helpers worked during lunch, due to the special menu with limited choices. Montreal was the most populous municipality in Quebec. It was also the second-largest city in Canada. In 2016, the greater Montreal area's population was more than 4 million, of which 1.75 million lived in Montreal's urban centre. The city was known for its tourism and hospitality. In 2013, the Montreal urban area alone was the home to 6,729 restaurants, which included 4,167 full-service establishments and 2,562 quick-service restaurants (see Exhibit 1). Despite a slight drop in 2016, down to 5,823 restau- rants, Montreal had one of the highest ratios of restaurants per capita in North America. According to Akutsu did all purchasing for the restaurant twice a week. The restaurant used 53 kilograms of salmon per week. Akutsu would travel to various markets to obtain the best and freshest ingredients at the most economical prices. He pre-processed most ingredients and then froze them for use over the subsequent three days. Akutsu was proud of his procurement skills, which resulted in high quality, low cost, and little waste. The restaurant's cost for goods and raw materials was only 20 per cent of Kazu's revenue, in comparison to most other Montreal restaurants, whose cost was closer to 40 per cent. Kazu was closed all day Tuesdays and Wednesdays as well as Saturday at lunch for food procurement and preparation. This was more closure time than the average, but the couple felt that it was necessary the Association des Restaurateurs du Quebec, Montrealers had an average of 26.81 restaurants per 10,000 population in 2014. In comparison, the highest rate in the United States was San Francisco at 21.44, followed by New York City at 19.57. given the pressure throughout the week. Lunch was served from noon to 3 p.m., and dinner customers were accepted only until 9:30 p.m. In comparison, many Montreal restaurants operated four or five weekdays, with extended dinner hours Thursday to Saturday and limited service on Sunday evenings. The couple also took vacation time, during which Kazu remained closed for extensive periods. Service hours and schedule changes were communicated on the restaurant's website and social media channels, such as Facebook, where Kazu had more than 6,000 followers. Restaurants were unquestionably a large contributor to the economy in Montreal, but the competition was fierce. The time to acquire a restaurant permit in Montreal was very short, which contributed to restaurant owners achieving thin average profit margins of only approximately 2.7 per cent (see Exhibit 2). Many restaurants closed only a few months after opening; in some cases, pressure from taxes and regulations for doing business in this region contributed to the closures. Another challenge Montreal restaurants faced was seasonality. Although July and August were very busy months thanks to tourism, the area's harsh winters prevented many diners from going outside during extreme weather days. SERVICE OUTLET Kazu adopted a humble aesthetic. The restaurant occupied a rented space with a narrow, inconspicuous facade. The tiny and cramped interior dining area of approximately 65 square metres (700 square feet) held six square tables along the windows and walls and 10 barstools facing the kitchen. The space normally sat 27 customers, but it could host up to 30 diners without blocking the pathway or regular service flows (see Exhibit 3). The restaurant decor was minimal, with seasonal post- ers on the wall. Akutsu had no intention of altering the layout or expanding the space. He even empha- sized the necessity of high density to portray an authentic feeling of dining in Tokyo. RESTAURANT KAZU Akutsu and his wife Yuko immigrated to Canada from Japan in 2001. Prior to the move, Akutsu was a chef in a kaiseki (a traditional Japanese cuisine) restaurant in Tokyo. When the couple first landed in Montreal, they found the city awash with sushi restaurants that were similar to each other and traditional in style, with little innovation. In 2010, the couple opened Restaurant Kazu in central Shaughnessy Village, at the west end of downtown Montreal, one of Quebec's most densely populated and demographically mixed neighbourhoods. The restaurant, which was easily accessible by public transit, was surrounded by high-rise residences, Victorian grey-stone row houses, universities, private schools, hospitals, and museums. The menu included izakaya (Japanese pub) grilled dishes and salads with home-made dressings in exquisite servings. After the restaurant opened, it attracted a per- sistent flow of daily waiting lines for lunch and dinneron weekdays and weekends, and during winter and summer. MENU DESIGN Kazu offered a full menu for dinner: 12 appetizers, 11 main courses, 6 grills, 2 raw fish dishes, and select dessert and drink options. Most appetizers were priced under CA$ 10, and the main dishes were approximately $15$25 each. The lunch menu had seven main courses at an average price of $12. In addition to providing the regular printed menu, the restaurant had hand-written information about many ad hoc offerings on the walls. These offerings were seasonal and highly dependent upon the avail- ability of the raw materials discovered during Akutsu's weekly purchases. The restaurant hoped to at- tract business customers with rare offerings such as a $39 tuna belly, while maintaining student patrons with more economical choices such as the $9 pork bowl. At all price levels, Kazu's dish layout was impressive. MANAGEMENT In 2012, the couple incorporated the business and became the only shareholders. They both worked in the restaurant every day that it was open. Akutsu was the main chef; Yuko was the cashier and general manager of the restaurant. Six servers worked during weekdays, with an additional server on weekends, and three helpers assisted the chef during dinner. Only two of the three chef helpers worked during lunch, due to the special menu with limited choices. Akutsu did all purchasing for the restaurant twice a week. The restaurant used 53 kilograms of salmon per week. Akutsu would travel to various markets to obtain the best and freshest ingredients at the most economical prices. He pre-processed most ingredients and then froze them for use over the subsequent three days. Akutsu was proud of his procurement skills, which resulted in high quality, low cost, and little waste. The restaurant's cost for goods and raw materials was only 20 per cent of Kazu's revenue, in comparison to most other Montreal restaurants, whose cost was closer to 40 per cent. Kazu's pricing followed a generic markup of the market prices Akutsu paid for ingredients. For popular menu items, such as the Tuna Salmon Salad Rice Bowl (see Exhibit 4), with shorter preparation times, the restaurant's profit was lucrative. Akutsu's ability to achieve lower costs through skilful procurement meant that the restaurant could enjoy substantially higher margins than many competitors. For an addi- tional source of income, Kazu sold its home-made dressing as a frozen food item at $6 per bottle, which could be stored for up to two months. More than 7,000 bottles of dressing had been sold at the tiny restaurant over the previous three years. Kazu was closed all day Tuesdays and Wednesdays as well as Saturday at lunch for food procurement and preparation. This was more closure time than the average, but the couple felt that it was necessary WAIT TIMES Kazu appeared in various news articles, and they all mentioned the everlasting long wait- ing lines. Akutsu was well aware of the problem, but he had been too busy running the business to deal with the problem until the most recent summer, when he met Ken Ling, a master of science (M.Sc.) candidate at the John Molson School of Business. Ling agreed to examine the long waiting times The restaurant could add business on Wednesday and Saturday by training additional chefs or procurement employees. I menu could be assessed for potential pricing adjustments, which could reduce long waiting lines. Technology such beepers could be introduced, which could ease the waiting process. Clearly, Kazu also had to be cautious of any operatio inefficiencies that may cause customers to be kept waiting even while the restaurant had vacant seats. Ultimately, Kazu wish to consider expanding the current restaurant space or add a second location. Prior to considering all alternatives. Aku first had to determine his priorities. Was he prepared to expand the current business, or did he prefer to stay in his com zonea small, family and community-oriented business? Would he want to take a more marketing approach and incre the menu price, or merely wish to look for an operational Ltions? In the end, what both he and Yuko wanted was for business to remain sustainable. As long as the customers are happy, we are happy," they agreed. EXHIBIT 1: COMMERCIAL FOOD SERVICE ESTABLISHMENTS, CITY OF MONTREAL Total Full-service restaurants Restricted food establishments Special catering services Contract catering services Catering Canteens and mobile counters Drinking establishments 2012 7,483 3,883 2,229 651 192 394 65 720 2013 8,290 4,167 2,562 771 194 486 91 790 2014 6,818 3,438 2,106 654 198 380 76 620 2015 6,939 3,487 2. 171 691 192 413 86 590 2016 7,125 3,492 2,331 692 192 418 82 610 Source: "Restauration: Nombre d'tablissements de services alimentaires commerciaux, agglomration de Montral, 2012- 2018." [in French). Ville de Montral: Montral en statistiques, accessed August 3, 2018, http://ville.montreal.qc.ca/portal/page?_pageid=8897,87887857&_dad=portal&_schema=PORTAL. EXHIBIT 2: FOOD SERVICE AND DRINKING ESTABLISHMENTS/SUMMARY STATISTICS, QUEBEC (IN CA$ MILLION) 2009 Summary Statistics Operating revenues Operating expenses Salaries, wages, and benefits Operating profit margins (%) 2008 9,492.9 9,018.7 3,182.4 5.0 9,453.0 9,032.4 3,025.5 4.4 2010 9,791.0 9,362.4 3,153.5 4.4 2011 10,040.1 9,641.5 3,209.4 4.0 2012 10,490.5 10,076.5 3,348.2 3.9 Full-Service Restaurants 2011 Summary Statistics Operating revenues Operating expenses Salaries, wages, and benefits Operating profit margins (%) 2008 4,839.7 4,656.4 1,731.3 3.8 2009 4,731.1 4,568.1 1,593.0 3.4 2010 4,767.3 4,604.7 1,603.9 3.4 4,919.0 4,791.7 1,640.3 2.6 2012 5,189.3 5,056.8 1,725.8 2.6 Limited-Service Eating Establishments E Summary Statistics Operating revenues Operating expenses Salaries, wages, and benefits Operating profit margins (%) 2008 2.989.9 2,799.8 904.5 6.4 2009 3,079.9 2,901.6 925.7 5.8 2010 3,3612 3,162.7 2011 3,505.4 3,338.1 1,068.6 4.8 2012 3,650.4 3,465.8 1,107.7 5.1 1,013.8 5.9 EXHIBIT 3: RESTAURANT KAZU FLOOR LAYOUT & INTERIOR SEATING IMAGES Ste Catherine St. W. Waiting Line Foyer TE T4 T5 Cashier Source: Company files. Kitchen EXHIBIT 4: BILL OF MATERIALSTUNA SALMON SALAD RICE BOWL 180g ground tuna or salmon 60g salad 150g steamed rice 5g Kazu topping 3 minute preparation Note: g = gram. Source: Company files Bathroom EXHIBIT 5: CUSTOMER ARRIVAL AND DEPARTURE DATA-DINNER, SATURDAY JUNE 2, 2018 Index Group Size Menu Table Payment Departure 2 5:17 5:17 5:17 5:17 N Order Taken 5:19 5:19 5:23 5:20 Table Numbe T5 B7-8 T4 T3 T6 B5-6 B3-4 Order Delivere 5:22 5:23 5:28 5:24 5:31 5:22 E. WN 5:56 5:50 6:10 5:55 6:25 8:05 4 on 4 2. 5:18 6:18 5:26 5:20 5:21 - 5:18 5:32 6:05 w N NN 5:22 5:23 WO00 Arrival 4:50 4:55 5:00 5:07 5:10 E. 5:11 5:14 5:21 5:22 5:23 5:25 5:27 5:33 5:36 5:38 5-40 5:42 5:42 5:44 5:45 5:45 5:47 5-49 B1-3 T2 B9-10 2 4 5:32 5:25 5:28 5:31 6:00 5:25 5:27 5:58 5:58 5:50 6:11 5:59 6:20 6:05 8:00 5:21 8:20 6:04 6:03 8:22 8:28 5:52 5:42 8:07 5:55 5:57 5:45 6:20 5:37 5:33 5:34 5:38 . 8:07 8:19 6:04 6:01 8:15 8-27 W 5:37 5:49 14 2 5:50 87-8 5:51 5:55 6:07 5:49 5:49 NNN 5:59 6:08 5:49 5:50 5:50 5:50 T3 B9-10 2 4 2 1 6:02 8:08 6:05 6:03 6:04 8:08 6:07 6:20 6:35 8:47 6:35 6:08 8:12 6:10 B5-8-7-8 T2 6:35 8:47 8:37 5:55 6:40 6:17 5:54 N 5:59 8:05 B3-4 6:07 6:09 6:46 6:18 6:58 NNN 6:16 6:17 8:19 6:20 6:22 6:17 6:20 es 6:22 8:23 T4 B1-2 T3 T1 6:22 6:25 6:26 8:28 6:25 6:28 8:30 7:05 7:07 7:00 2 2 2 2 5 8:27 8:33 8:35 7:03 6:27 6:25 6:26 6:27 6:27 8:30 6:30 6:58 7:07 7:07 7:01 6:24 7:04 8:28 8:28 7:20 7:24 7:30 7:17 za 7:20 3 8:31 6:35 NW N N + 8:30 6:30 6:30 6:38 6:49 1.47 6:47 TE B9-10 T2 B3-4-5 87-8 T1 T4 8:34 6:38 8:43 6:50 6:51 7:03 8:39 6:42 8:46 6:53 e. 6:53 7:19 7:23 7:27 7:16 7:23 7:32 8:02 6:30 6:32 6:33 6:36 6:37 6:37 6:40 3 8:40 8:40 8:40 7:02 6:58 7:05 7:04 7:00 N N 2 7:33 8:03 8:39 7:45 7:35 4 7:17 + 6:48 6:49 B3-4-5-6 T6/T3 7:21 7:05 22 N 7:03/7:08 EXHIBIT 5 (CONTINUED) Index Arrival Menu 45 46 47 Group Size 2 5 3 6:49 6:54 6:54 8:54 Table 7:07 7:09 7:20 Table Number B1-2 T5 Order Taken 7:13 7:13 7:25 Order Delivered 7:15 7:17 7:32 8:01 48 7:24 B9-10 7:26 7:28 49 50 51 52 53 54 7:33 7:33 7:33 7:42 N N N N N N N N N N N N N N N O on 55 56 57 58 59 60 61 62 63 64 65 7:24 7:28 7:33 7:35 7:44 7:45 8:03 7:45 8:13 8:03 8:16 8:03 8:17 B7-8 T2 T1 T3 B1-2 B5-6 T5 B3-4 T1 T4 T6 T2 7:26 7:30 7:36 7:41 7:49 7:52 8:04 7:47 8:14 8:05 8:18 8:04 8:23 7:31 7:39 7:43 7:45 7:52 7:56 8:07 7:51 8:20 8:11 8:23 8:07 8:26 4 2 5 7:53 T3 6:42 6:42 6:43 8:45 6:49 6:59 7:02 7:05 7:07 7:20 7:23 7:26 7:28 7:30 7:33 7:42 7:44 7:49 7:51 7:54 8:10 8:12 8:19 8:31 8:36 8:36 8:38 8:40 8:41 8:45 8:45 8:45 8:46 8:53 8:59 9:00 9:00 9:03 9:19 9:21 9:27 Payment Departur 7:43 7:44 8:14 8:16 8:01 7:05 8:17 8:17 7:08 8:25 8:28 8:01 8:02 8:13 8:15 8:17 8:17 8:42 8:44 8:38 8:41 8:41 8:44 8:25 8:27 8:51 8:53 8:37 8:38 9:04 9:05 8:31 8:32 9:22 9:26 7:55 8:15 8:50 8:50 8:19 9:05 9:06 9:07 9:07 9:21 9:22 9:49 9:50 9:24 9:26 10:10 10:11 9:25 9:27 9:53 9:57 10:16 10:17 9:51 9:54 9:48 9:48 9:48 9:49 9:12 10:23 10:24 9:59 10:00 10:23 10:24 9:27 10:11 10:12 66 1 8:17 810 8:22 8:28 67 68 69 70 NW N N N N N N 2 B8-9 B3-4 T2 T4 71 72 73 8:31 8:36 8:36 8:38 8:40 8:42/8:45 8:45 8:53 9:05 9:06 9:07 9:22 B5-6-7 T5/B1-2 T5 8:34 8:40 8:41 8:44 8:43 8:54 8:48 9:00 9:08 9:07 9:10 9:24 8:40 8:42 8:43 8:51 8:49 8:56 8:56 9:03 9:13 9:11 9:15 9:27 74 75 76 4 T1 8:50 8:50 8:50 2 2 B9-10 77 T6 B3-4 T2 78 79 80 81 82 83 84 2 3 2. 2 2 9:25/9:28 9:25 9:29 B5-6/T3 B7-8 B5-6 9:30 9:27 9:29 9:35 9:31 9:32 2 85 3 9:29 T5 9:32 9:36


