Question: Case History B 1. General Information Proper evaluation and completion of this case study will prepare you for a similar cane for your certification examination.
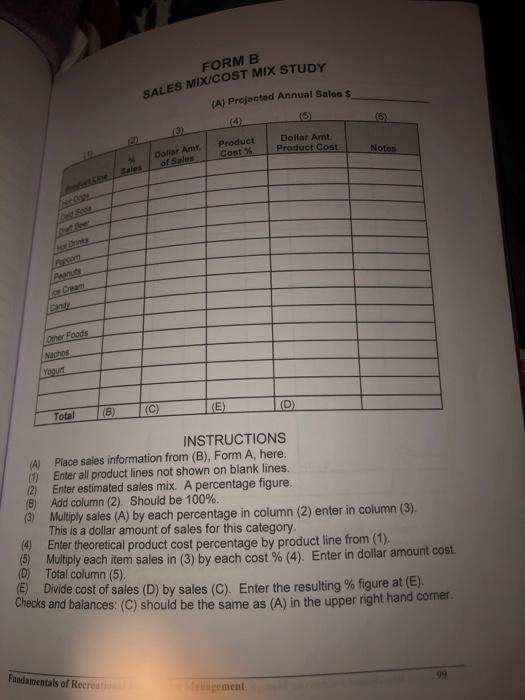
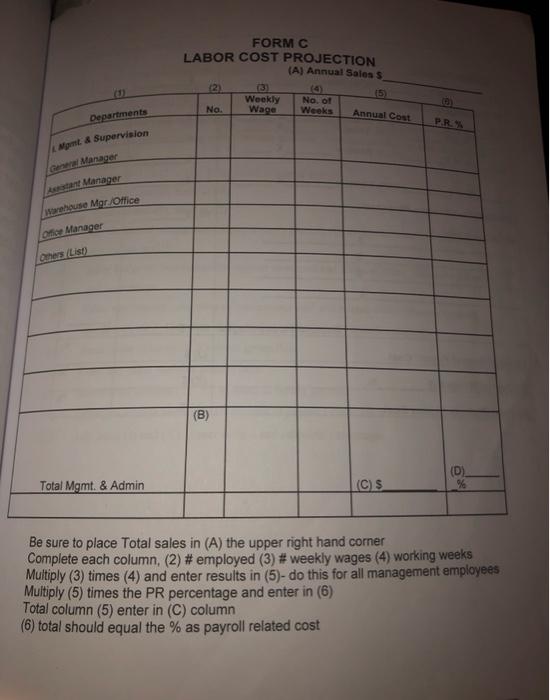
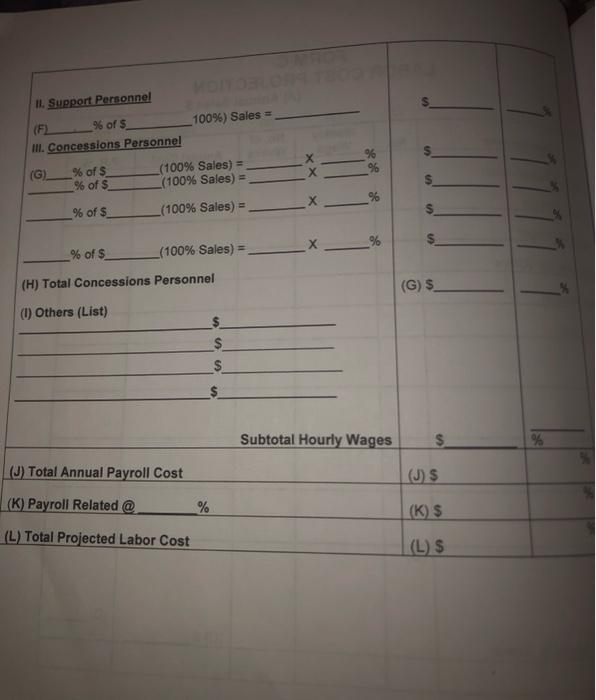

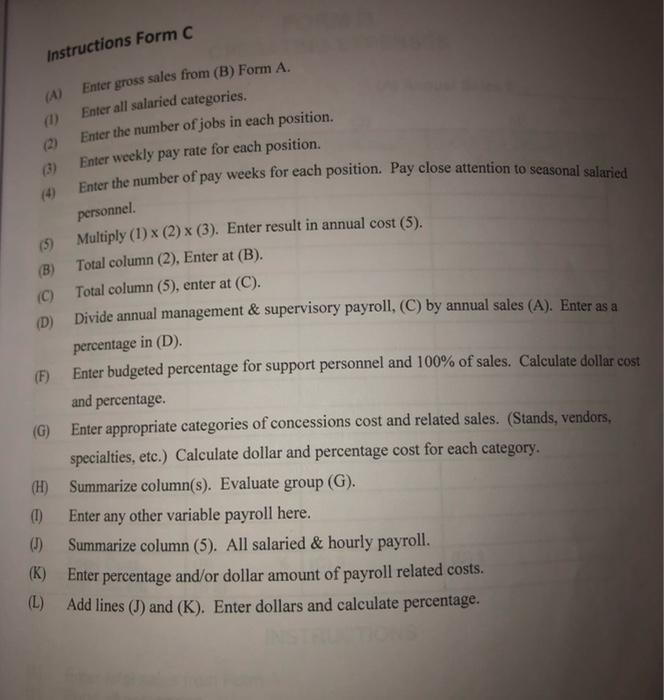
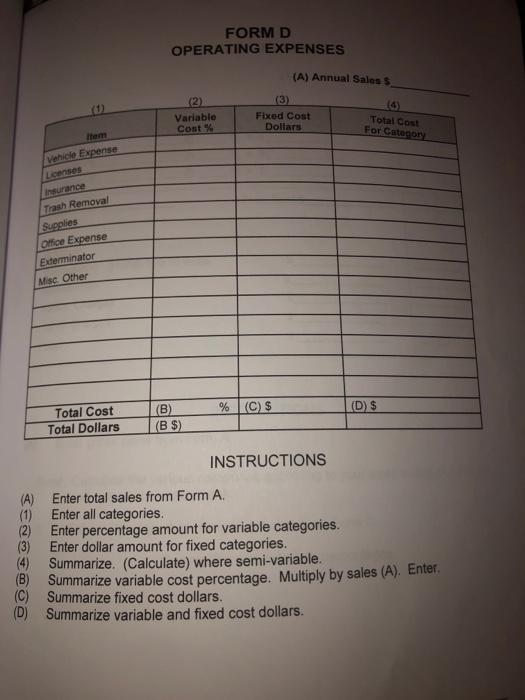
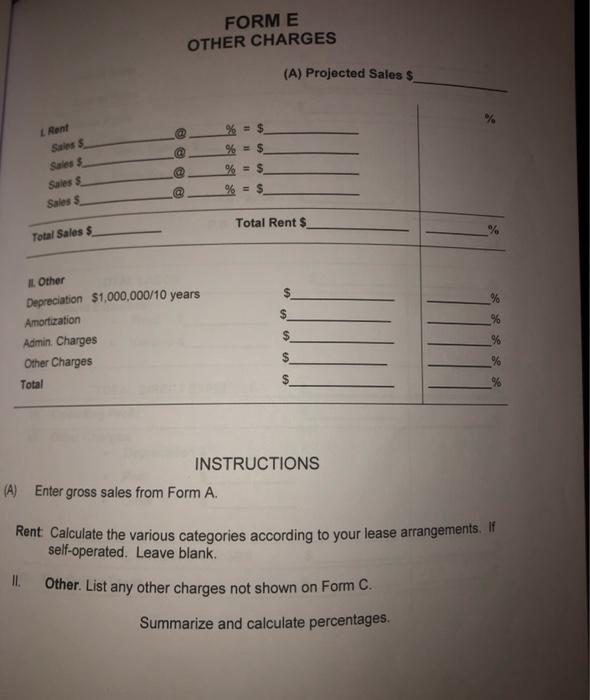
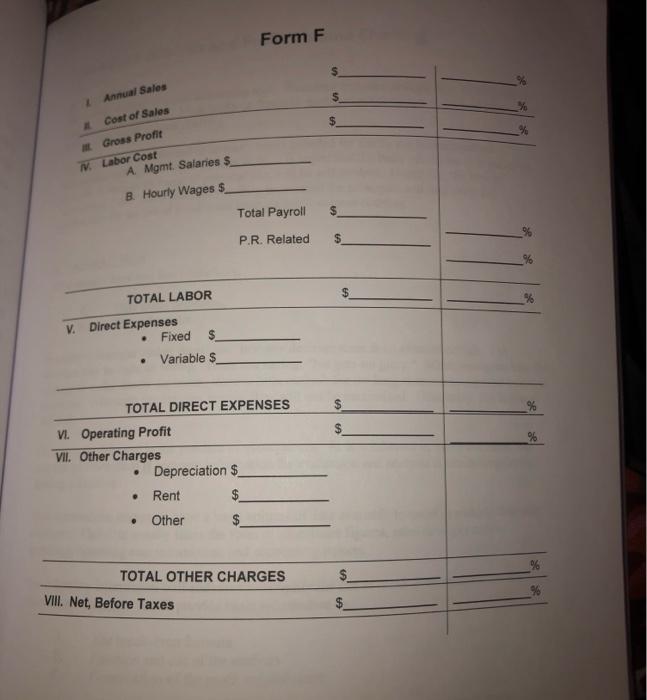
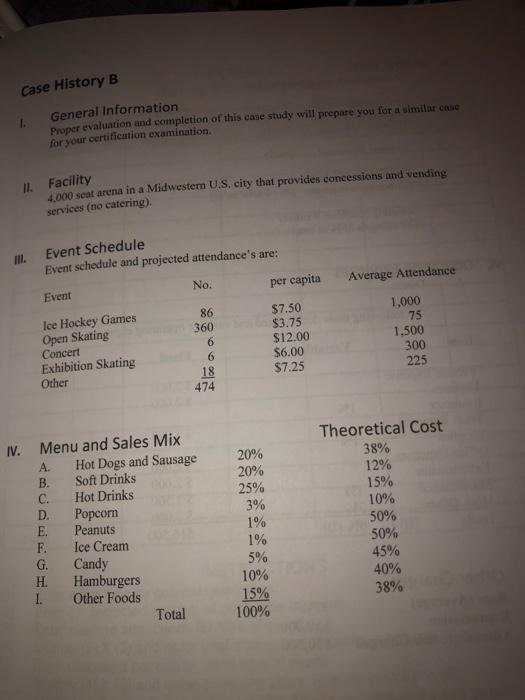
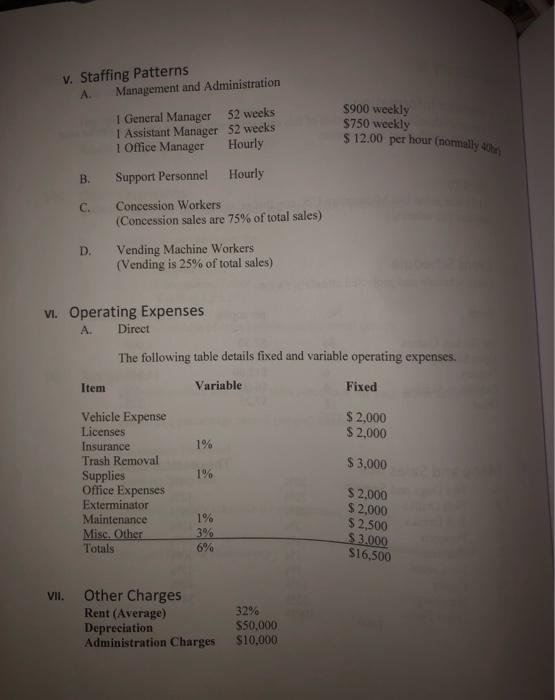
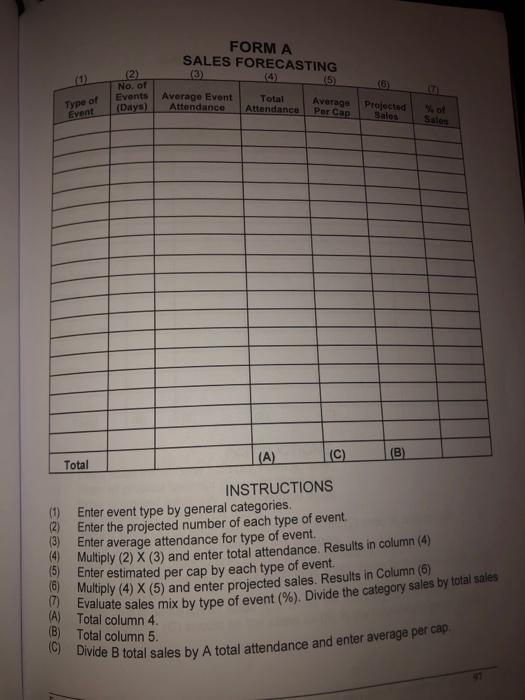
Case History B 1. General Information Proper evaluation and completion of this case study will prepare you for a similar cane for your certification examination. II. Facility 4,000 seat arena in a Midwestern U.S. city that provides concessions and vending services (no catering) III. Event Schedule Event schedule and projected attendance's are: No. per capita Average Attendance Event Ice Hockey Games Open Skating Concert Exhibition Skating Other 86 360 6 6 18 474 $7.50 $3.75 $12.00 $6.00 $7.25 1.000 75 1,500 300 225 IV. Menu and Sales Mix A Hot Dogs and Sausage B. Soft Drinks C. Hot Drinks D. Popcom E. Peanuts F. Ice Cream G. Candy H. Hamburgers I. Other Foods Total 20% 20% 25% 3% 1% 1% 5% 10% 15% 100% Theoretical Cost 38% 12% 15% 10% 50% 50% 45% 40% 38% v. Staffing Patterns A. Management and Administration 1 General Manager 52 weeks 1 Assistant Manager 52 weeks 1 Office Manager Hourly $900 weekly $750 weekly $ 12.00 per hour (normally subir B. Support Personnel Hourly C. Concession Workers (Concession sales are 75% of total sales) D. Vending Machine Workers (Vending is 25% of total sales) Vi. Operating Expenses A. Direct The following table details fixed and variable operating expenses. Item Variable Fixed $ 2,000 $ 2,000 1% $ 3.000 1% Vehicle Expense Licenses Insurance Trash Removal Supplies Office Expenses Exterminator Maintenance Misc. Other Totals 1% 3% $ 2.000 $ 2,000 $ 2.500 $ 3.000 S16,500 VII. Other Charges Rent (Average) Depreciation Administration Charges 32% $50,000 $10,000 FORM A SALES FORECASTING (3) (5) (6) (2) No. of Events (Days) Type of Event Average Event Attendance Total Attendance Average Per Cap Projecte Sales Sale (A) (C) (B) Total INSTRUCTIONS (1) Enter event type by general categories (2) Enter the projected number of each type of event (3) Enter average attendance for type of event. 19 Multiply (2) X (3) and enter total attendance. Results in column (4) (5) Enter estimated per cap by each type of event. Multiply (4) X (5) and enter projected sales. Results in Column (6) (0) Evaluate sales mix by type of event (%). Divide the category sales by total sales (A) Total column 4. (B) Total column 5. (6) Divide B total sales by A total attendance and enter average per cap FORM B SALES MIX/COST MIX STUDY (A) Projected Annual Sales $ (4) (6) (8) Product Cost Dollar Amt Product Cost Notes Dollar Amt of Sales Sales NO Anam can lomer Foods Nachos Yout (D) (B) (C) (E) Total INSTRUCTIONS (4) Place sales information from (B), Form A, here. (1) Enter all product lines not shown on blank lines. (2) Enter estimated sales mix. A percentage figure. Add column (2). Should be 100%. (3) Multiply sales (A) by each percentage in column (2) enter in column (3) This is a dollar amount of sales for this category. (4) Enter theoretical product cost percentage by product line from (1). 5 Multiply each item sales in (3) by each cost % (4). Enter in dollar amount cost. (D) Total column (5) (E) Divide cost of sales (D) by sales (C). Enter the resulting % figure at (E). Checks and balances: (C) should be the same as (A) in the upper right hand corner. Fundamentals of Recreation FORM C LABOR COST PROJECTION (A) Annual Sales S 15 4 No. 1 Weeks Weekly Wage Na. Annual Cost P.RS Departments Mint & Supervision Geral Manager A Manager the Mgr Office Omice Manager Ces List (8) Total Mgmt & Admin (CS Be sure to place Total sales in (A) the upper right hand corner Complete each column. (2) # employed (3) #weekly wages (4) working weeks Multiply (3) times (4) and enter results in (5)- do this for all management employees Multiply (5) times the PR percentage and enter in (6) Total column (5) enter in (C) column (6) total should equal the % as payroll related cost 3 II. Support Personnel (F) % of $ 100%) Sales = II. Concessions Personnel (G) % of (100% Sales) = % of $. (100% Sales) = % of $ (100% Sales) = XX % $ $ s $ X % of $ _(100% Sales) = (H) Total Concessions Personnel (G)S (1) Others (List) $ Subtotal Hourly Wages % (J) Total Annual Payroll Cost (J) $ (K) Payroll Related @ % (K) $ (L) Total Projected Labor Cost (L) $ Instructions Form C (A) Enter gross sales from (B) Form A. (1) Enter all salaried categories. (2) Enter the number of jobs in each position. (3) Enter weekly pay rate for each position. Enter the number of pay weeks for each position. Pay close attention to seasonal salaried personnel (B) (9) Multiply (1) (2) (3). Enter result in annual cost (5). Total column (2), Enter at (B). (C) Total column (5), enter at (C). (D) Divide annual management & supervisory payroll, (C) by annual sales (A). Enter as a percentage in (D) (F) Enter budgeted percentage for support personnel and 100% of sales. Calculate dollar cost and percentage. (G) Enter appropriate categories of concessions cost and related sales. (Stands, vendors, specialties, etc.) Calculate dollar and percentage cost for each category. (H) Summarize column(s). Evaluate group (G). (1) Enter any other variable payroll here. Summarize column (5). All salaried & hourly payroll. (K) Enter percentage and/or dollar amount of payroll related costs. (L) Add lines (J) and (K). Enter dollars and calculate percentage. Instructions Form C (A) Enter gross sales from (B) Form A. (1) Enter all salaried categories. (2) Enter the number of jobs in each position. (3) Enter weekly pay rate for each position. Enter the number of pay weeks for each position. Pay close attention to seasonal salaried personnel (B) (9) Multiply (1) (2) (3). Enter result in annual cost (5). Total column (2), Enter at (B). (C) Total column (5), enter at (C). (D) Divide annual management & supervisory payroll, (C) by annual sales (A). Enter as a percentage in (D) (F) Enter budgeted percentage for support personnel and 100% of sales. Calculate dollar cost and percentage. (G) Enter appropriate categories of concessions cost and related sales. (Stands, vendors, specialties, etc.) Calculate dollar and percentage cost for each category. (H) Summarize column(s). Evaluate group (G). (1) Enter any other variable payroll here. Summarize column (5). All salaried & hourly payroll. (K) Enter percentage and/or dollar amount of payroll related costs. (L) Add lines (J) and (K). Enter dollars and calculate percentage. FORM D OPERATING EXPENSES (A) Annual Saless (0) Variable Cont% (3) Fixed Cost Dollars 14 Total Cost For Category Item Vehicle Expense Lenses Insurance Tash Removal Supplies Office Expense Exterminator Misc Other % $ (D) $ Total Cost Total Dollars (B) (BS) INSTRUCTIONS (A) Enter total sales from Form A. (1) Enter all categories. (2) Enter percentage amount for variable categories. (3) Enter dollar amount for fixed categories. (4) Summarize. (Calculate) where semi-variable. (B) Summarize variable cost percentage. Multiply by sales (A). Enter (C) Summarize fixed cost dollars. (D) Summarize variable and fixed cost dollars. FORME OTHER CHARGES (A) Projected Sales S Rent selbe 1 $ Sain s Sales 5 Sales & Sales 5 11 Total Rent $ Total Sales S IL Other Depreciation $1,000,000/10 years Amortization Admin. Charges Other Charges Total $ INSTRUCTIONS (A) Enter gross sales from Form A. Rent Calculate the various categories according to your lease arrangements. If self-operated. Leave blank. IL Other. List any other charges not shown on Form C. Summarize and calculate percentages. Form F Annual Sales Cost of Sales Gross Profit Labor Cost A Mgmt. Salaries $ B. Hourly Wages $ Total Payroll P.R. Related TOTAL LABOR V. Direct Expenses Fixed $ Variable $ . $ TOTAL DIRECT EXPENSES VI. Operating Profit VII. Other Charges Depreciation $ Rent Other $ $ . TOTAL OTHER CHARGES $ VIII. Net, Before Taxes Case History B 1. General Information Proper evaluation and completion of this case study will prepare you for a similar cane for your certification examination. II. Facility 4,000 seat arena in a Midwestern U.S. city that provides concessions and vending services (no catering) III. Event Schedule Event schedule and projected attendance's are: No. per capita Average Attendance Event Ice Hockey Games Open Skating Concert Exhibition Skating Other 86 360 6 6 18 474 $7.50 $3.75 $12.00 $6.00 $7.25 1.000 75 1,500 300 225 IV. Menu and Sales Mix A Hot Dogs and Sausage B. Soft Drinks C. Hot Drinks D. Popcom E. Peanuts F. Ice Cream G. Candy H. Hamburgers I. Other Foods Total 20% 20% 25% 3% 1% 1% 5% 10% 15% 100% Theoretical Cost 38% 12% 15% 10% 50% 50% 45% 40% 38% v. Staffing Patterns A. Management and Administration 1 General Manager 52 weeks 1 Assistant Manager 52 weeks 1 Office Manager Hourly $900 weekly $750 weekly $ 12.00 per hour (normally subir B. Support Personnel Hourly C. Concession Workers (Concession sales are 75% of total sales) D. Vending Machine Workers (Vending is 25% of total sales) Vi. Operating Expenses A. Direct The following table details fixed and variable operating expenses. Item Variable Fixed $ 2,000 $ 2,000 1% $ 3.000 1% Vehicle Expense Licenses Insurance Trash Removal Supplies Office Expenses Exterminator Maintenance Misc. Other Totals 1% 3% $ 2.000 $ 2,000 $ 2.500 $ 3.000 S16,500 VII. Other Charges Rent (Average) Depreciation Administration Charges 32% $50,000 $10,000 FORM A SALES FORECASTING (3) (5) (6) (2) No. of Events (Days) Type of Event Average Event Attendance Total Attendance Average Per Cap Projecte Sales Sale (A) (C) (B) Total INSTRUCTIONS (1) Enter event type by general categories (2) Enter the projected number of each type of event (3) Enter average attendance for type of event. 19 Multiply (2) X (3) and enter total attendance. Results in column (4) (5) Enter estimated per cap by each type of event. Multiply (4) X (5) and enter projected sales. Results in Column (6) (0) Evaluate sales mix by type of event (%). Divide the category sales by total sales (A) Total column 4. (B) Total column 5. (6) Divide B total sales by A total attendance and enter average per cap FORM B SALES MIX/COST MIX STUDY (A) Projected Annual Sales $ (4) (6) (8) Product Cost Dollar Amt Product Cost Notes Dollar Amt of Sales Sales NO Anam can lomer Foods Nachos Yout (D) (B) (C) (E) Total INSTRUCTIONS (4) Place sales information from (B), Form A, here. (1) Enter all product lines not shown on blank lines. (2) Enter estimated sales mix. A percentage figure. Add column (2). Should be 100%. (3) Multiply sales (A) by each percentage in column (2) enter in column (3) This is a dollar amount of sales for this category. (4) Enter theoretical product cost percentage by product line from (1). 5 Multiply each item sales in (3) by each cost % (4). Enter in dollar amount cost. (D) Total column (5) (E) Divide cost of sales (D) by sales (C). Enter the resulting % figure at (E). Checks and balances: (C) should be the same as (A) in the upper right hand corner. Fundamentals of Recreation FORM C LABOR COST PROJECTION (A) Annual Sales S 15 4 No. 1 Weeks Weekly Wage Na. Annual Cost P.RS Departments Mint & Supervision Geral Manager A Manager the Mgr Office Omice Manager Ces List (8) Total Mgmt & Admin (CS Be sure to place Total sales in (A) the upper right hand corner Complete each column. (2) # employed (3) #weekly wages (4) working weeks Multiply (3) times (4) and enter results in (5)- do this for all management employees Multiply (5) times the PR percentage and enter in (6) Total column (5) enter in (C) column (6) total should equal the % as payroll related cost 3 II. Support Personnel (F) % of $ 100%) Sales = II. Concessions Personnel (G) % of (100% Sales) = % of $. (100% Sales) = % of $ (100% Sales) = XX % $ $ s $ X % of $ _(100% Sales) = (H) Total Concessions Personnel (G)S (1) Others (List) $ Subtotal Hourly Wages % (J) Total Annual Payroll Cost (J) $ (K) Payroll Related @ % (K) $ (L) Total Projected Labor Cost (L) $ Instructions Form C (A) Enter gross sales from (B) Form A. (1) Enter all salaried categories. (2) Enter the number of jobs in each position. (3) Enter weekly pay rate for each position. Enter the number of pay weeks for each position. Pay close attention to seasonal salaried personnel (B) (9) Multiply (1) (2) (3). Enter result in annual cost (5). Total column (2), Enter at (B). (C) Total column (5), enter at (C). (D) Divide annual management & supervisory payroll, (C) by annual sales (A). Enter as a percentage in (D) (F) Enter budgeted percentage for support personnel and 100% of sales. Calculate dollar cost and percentage. (G) Enter appropriate categories of concessions cost and related sales. (Stands, vendors, specialties, etc.) Calculate dollar and percentage cost for each category. (H) Summarize column(s). Evaluate group (G). (1) Enter any other variable payroll here. Summarize column (5). All salaried & hourly payroll. (K) Enter percentage and/or dollar amount of payroll related costs. (L) Add lines (J) and (K). Enter dollars and calculate percentage. Instructions Form C (A) Enter gross sales from (B) Form A. (1) Enter all salaried categories. (2) Enter the number of jobs in each position. (3) Enter weekly pay rate for each position. Enter the number of pay weeks for each position. Pay close attention to seasonal salaried personnel (B) (9) Multiply (1) (2) (3). Enter result in annual cost (5). Total column (2), Enter at (B). (C) Total column (5), enter at (C). (D) Divide annual management & supervisory payroll, (C) by annual sales (A). Enter as a percentage in (D) (F) Enter budgeted percentage for support personnel and 100% of sales. Calculate dollar cost and percentage. (G) Enter appropriate categories of concessions cost and related sales. (Stands, vendors, specialties, etc.) Calculate dollar and percentage cost for each category. (H) Summarize column(s). Evaluate group (G). (1) Enter any other variable payroll here. Summarize column (5). All salaried & hourly payroll. (K) Enter percentage and/or dollar amount of payroll related costs. (L) Add lines (J) and (K). Enter dollars and calculate percentage. FORM D OPERATING EXPENSES (A) Annual Saless (0) Variable Cont% (3) Fixed Cost Dollars 14 Total Cost For Category Item Vehicle Expense Lenses Insurance Tash Removal Supplies Office Expense Exterminator Misc Other % $ (D) $ Total Cost Total Dollars (B) (BS) INSTRUCTIONS (A) Enter total sales from Form A. (1) Enter all categories. (2) Enter percentage amount for variable categories. (3) Enter dollar amount for fixed categories. (4) Summarize. (Calculate) where semi-variable. (B) Summarize variable cost percentage. Multiply by sales (A). Enter (C) Summarize fixed cost dollars. (D) Summarize variable and fixed cost dollars. FORME OTHER CHARGES (A) Projected Sales S Rent selbe 1 $ Sain s Sales 5 Sales & Sales 5 11 Total Rent $ Total Sales S IL Other Depreciation $1,000,000/10 years Amortization Admin. Charges Other Charges Total $ INSTRUCTIONS (A) Enter gross sales from Form A. Rent Calculate the various categories according to your lease arrangements. If self-operated. Leave blank. IL Other. List any other charges not shown on Form C. Summarize and calculate percentages. Form F Annual Sales Cost of Sales Gross Profit Labor Cost A Mgmt. Salaries $ B. Hourly Wages $ Total Payroll P.R. Related TOTAL LABOR V. Direct Expenses Fixed $ Variable $ . $ TOTAL DIRECT EXPENSES VI. Operating Profit VII. Other Charges Depreciation $ Rent Other $ $ . TOTAL OTHER CHARGES $ VIII. Net, Before Taxes