

Question: CASE NOTES: The spreadsheet contains the sales data for two years from Isabella's current location. For the analysis complete the following : -Graph 2020 &
CASE NOTES:
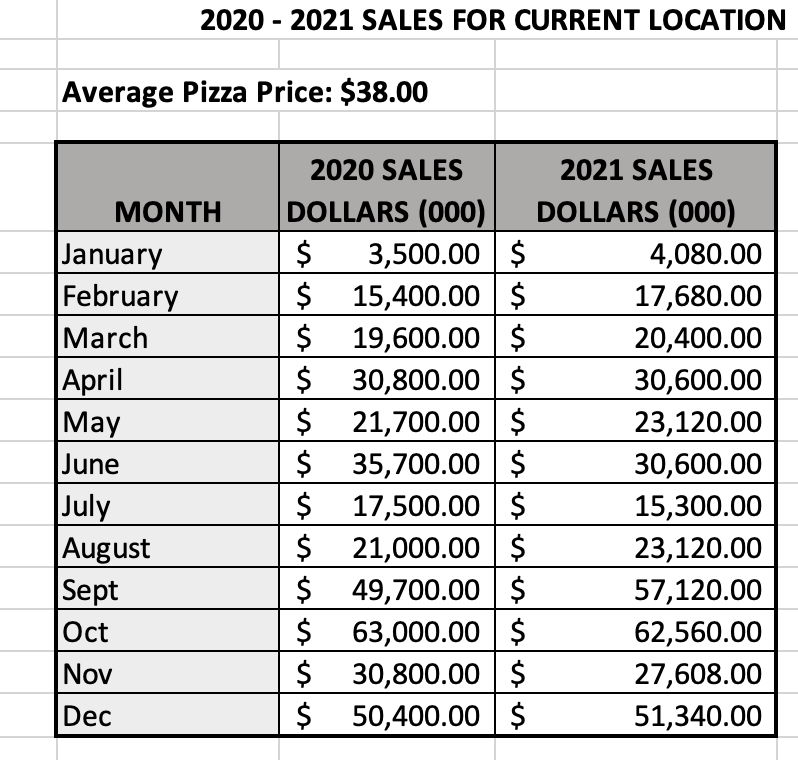
The spreadsheet contains the sales data for two years from Isabella's current location.
For the analysis complete the following:
-Graph 2020 & 2021 sales on the same graph to look for seasonality. Hint: How often does the data appear to repeat & in what timeframes?
-Determine how many seasons there are?
-Complete a forecast analysis for 2022's new location. Include the following:
-2020-2021 Average Seasonal Sales
-2020-2021 Overall Average Sales (24 months of data!)
-Seasonal Index for each season
-2022 Aggregate Sales Projection - She expect 2021 sales with a 4% increase at the new location.
-Breakdown of 2022 Sales Projections by Season
Step by Step Solution
There are 3 Steps involved in it
1 Expert Approved Answer
Step: 1 Unlock

Question Has Been Solved by an Expert!
Get step-by-step solutions from verified subject matter experts
Step: 2 Unlock
Step: 3 Unlock