

Question: CASE NOTES: This spreadsheet contains yearly operating fixed costs & per patient variable costs for three different MRI Scanning Machine models. A Crossover Point Graph
 CASE NOTES:
This spreadsheet contains yearly operating fixed costs & per patient variable costs for three different MRI Scanning Machine models. A Crossover Point Graph will help to visually determine the correct choice based on patient counts for 2023. Only half the patient counts need to be considered as the hospital plans to purchase two machines.
Additionally the Crossover points need to be calculated algebraically to detemine the exact break even point for each patient count.
COMPLETE THE FOLLOWING ANALYSIS:
Detemine total number of patients expected for Year 2023 based on 12% growth.
Calculate the 2023 patient count. (Two machines will be used.)
Graph the cost curves for each of the three machines showing visually the crossover points. Steps include:
Set up a range of patients from 0 to of 2022 Forecast
HINT: Increase by increments of 100 patients up to 1600 for the best graph!
Set up columns with formulas calculating the fixed & variable costs totals for each machine type based on patient count.
Highlight the data & create a line graph showing all three costs curves.
Be sure to change the Chart Title to something meaningful & include a legend.
Mathematically calculate patient crossover points where the total costs are equal for:
Siemens vs. General Electric
Philips vs. Siemens
Indicate which machine brand should be purchased based on future patient forecasts & costs.
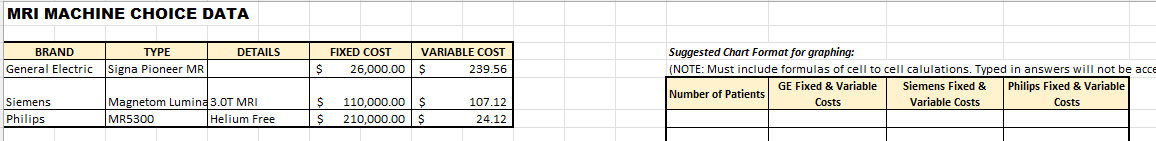
MRI MACHINE CHOICE DATA \begin{tabular}{|l|l|l|lr|rr|} \hline \multicolumn{1}{|c|}{ BRAND } & \multicolumn{1}{c|}{ TYPE } & \multicolumn{1}{c|}{ DETAILS } & \multicolumn{2}{c|}{ FIXED COST } & \multicolumn{2}{c|}{ VARIABLE COST } \\ \hline General Electric & Signa Pioneer MR & & $ & 26,000.00 & $ & 239.56 \\ \hline & & & & & & \\ Siemens & Magnetom Lumin & 3.0 T MRI & $ & 110,000.00 & $ & 107.12 \\ \hline Philips & MR5300 & Helium Free & $ & 210,000.00 & $ & 24.12 \\ \hline \end{tabular} Suggested Chart Format for graphing: (NOTE: Must include formulas of cell to cell calulations. Typed in answers will not be acce \begin{tabular}{|c|c|c|c|} \hline Number of Patients & GEFixed&VariableCosts & SiemensFixed&VariableCosts & PhilipsFixed&VariableCosts \\ \hline & & & \\ \hline \end{tabular}
Step by Step Solution
There are 3 Steps involved in it

Get step-by-step solutions from verified subject matter experts