

Question: CASE NOTES: This spreadsheet contains yearly operating fixed costs & per patient variable costs for three different MRI Scanning Machine models. A Crossover Point Graph
CASE NOTES:
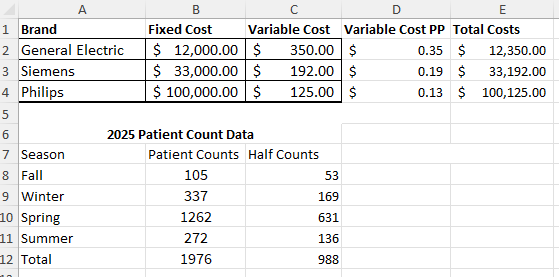
This spreadsheet contains yearly operating fixed costs & per patient variable costs for three different MRI Scanning Machine models. A Crossover Point Graph will help to visually determine the correct choice based on patient counts for
Only half the patient count needs to be considered as the hospital plans to purchase two machines.
Additionally the crossover points need to be calculated algebraically to detemine the exact break even point for each patient count. Using the exact crossover points comparison to the new Patient Counts, determine which MRI machine is most cost effective.
COMPLETE THE FOLLOWING ANALYSIS:
Determine total number of patients expected for Year based on growth. Use your data from CASE PART ONE.
Calculate the patient count.Two machines will be used. Round to nearest whole number of patients.
Graph the cost curves for each of the three machines showing visually the crossover points. Steps include:
Set up a range of patients from to of Forecast
HINT: Increase by increments of patients up to patients for the best graph!
Set up the rows with formulas calculating the fixed & variable costs totals for each machine type based on patient count starting at ZERO patients.
Highlight the data & create a line graph showing all three costs curves.
Be sure to change the Chart Title to something meaningful & include a legend.
Mathematically calculate patient crossover points where the total costs are equal.
NOTE: Type in the algebraic formulas & steps to determine the exact patient count at break even comparing two machines at a time.
Siemens vs General Electric
Philips vs Siemens
Lastly identify which machine brand should be purchased based on future patient forecasts & costs.
NOTE: Cells where formula calculations are required should not be typed in numbers.
Step by Step Solution
There are 3 Steps involved in it
1 Expert Approved Answer
Step: 1 Unlock

Question Has Been Solved by an Expert!
Get step-by-step solutions from verified subject matter experts
Step: 2 Unlock
Step: 3 Unlock