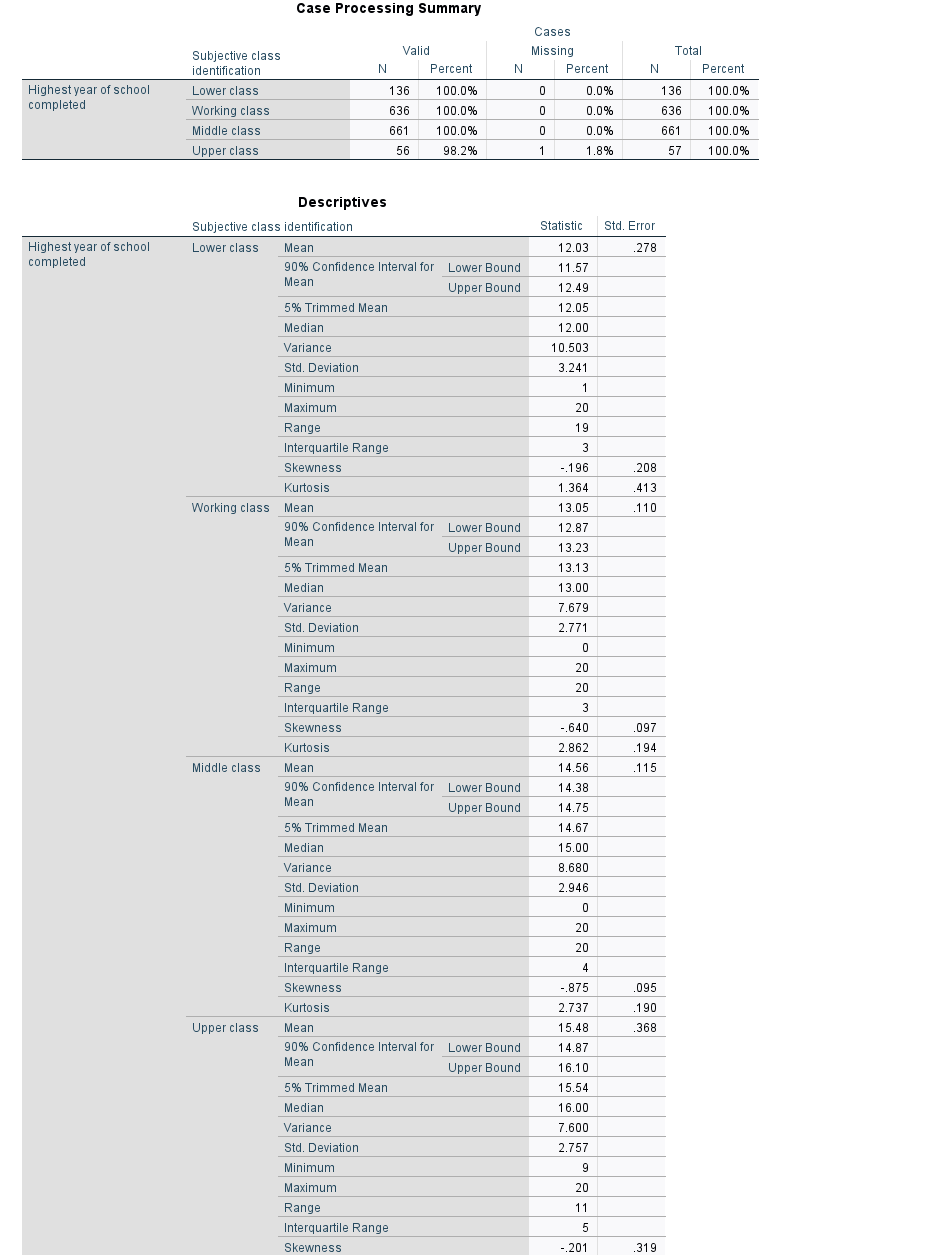
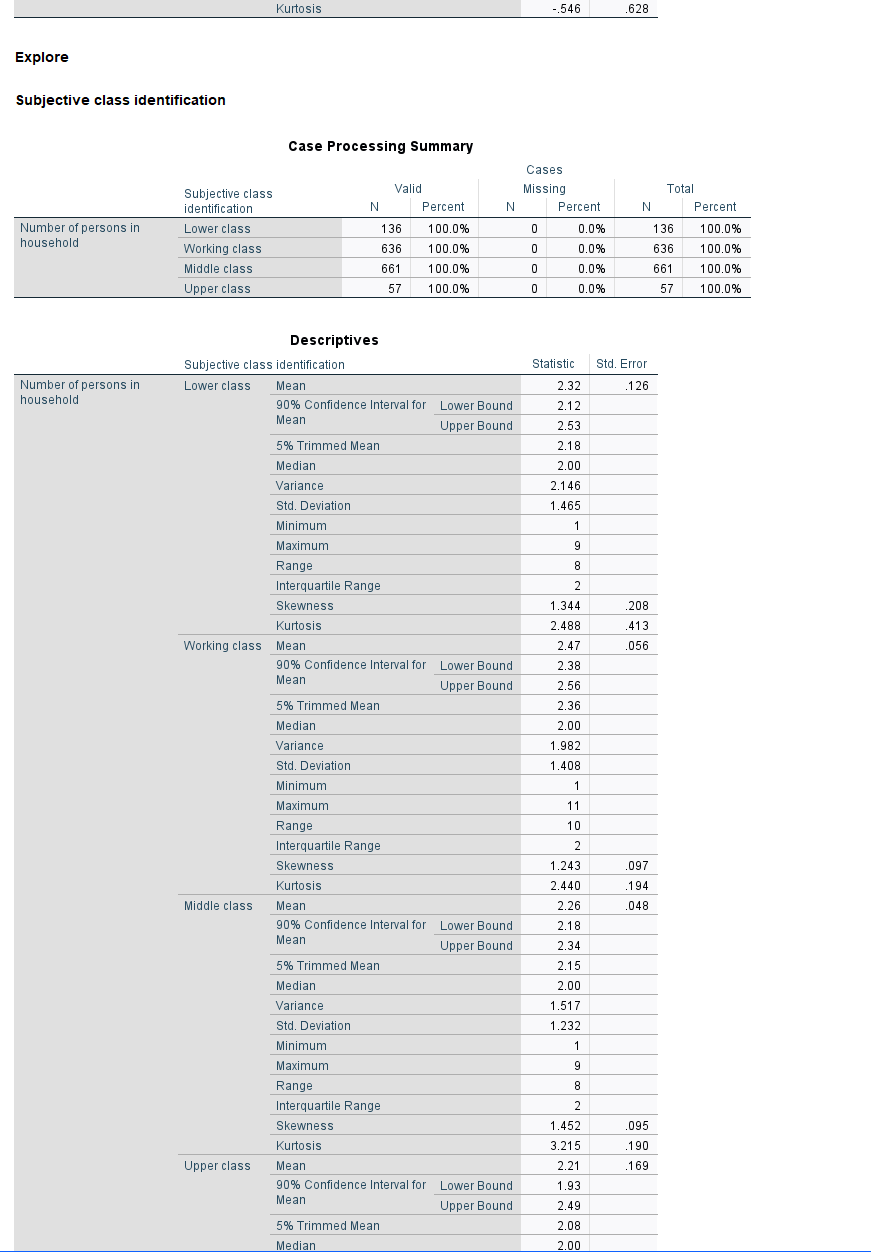
Question: Case Processing Summary Cases Total Subjective class Valid Missing identification N Percent N Percent N Percent Highest year of school Lower class 136 100.0% 0

Case Processing Summary Cases Total SubjectiveCase Processing Summary Cases Total SubjectiveCase Processing Summary Cases Total Subjective
Case Processing Summary Cases Total Subjective class Valid Missing identification N Percent N Percent N Percent Highest year of school Lower class 136 100.0% 0 0.0% 136 100.0% completed Working class 636 100.0% O 0.0% 636 100.0% Middle class 661 100.0% 0 0.0% 661 100.0% Upper class 56 98.2% 1 1.8% 57 100.0% Descriptives Subjective class identification Statistic Std. Error Highest year of school Lower class Mean 12.03 278 completed 90% Confidence Interval for Lower Bound 11.57 Mean Upper Bound 12.49 5% Trimmed Mean 12.05 Median 12.00 Variance 10.503 Std. Deviation 3.24 Minimum Maximum 20 Range 19 Interquartile Range 3 Skewness -. 196 .208 Kurtosis 1.364 413 Working class Mean 13.05 110 90% Confidence Interval for Lower Bound 12.87 Mean Upper Bound 13.23 5% Trimmed Mean 13.13 Median 13.00 Variance 7.679 Std. Deviation 2.771 Minimum 0 Maximum 20 Range 20 Interquartile Range 3 Skewness ..640 097 Kurtosis 2.862 194 Middle class Mean 4.56 .115 90% Confidence Interval for Lower Bound 4.38 Mean Upper Bound 14.75 5% Trimmed Mean 14.67 Median 15.00 Variance 8.680 Std. Deviation 2.946 Minimum 0 Maximum 20 Range 20 Interquartile Range Skewness -.875 095 Kurtosis 2.737 190 Upper class Mean 15.48 .368 90% Confidence Interval for Lower Bound 14.87 Mean Upper Bound 16.10 5% Trimmed Mean 15.54 Median 16.00 Variance 7.600 Std. Deviation 2.757 Minimum Maximum 20 Range 11 Interquartile Range 5 Skewnes .201 319Kurtosis -.546 .628 Explore Subjective class identification Case Processing Summary Cases Subjective class Valid Missing Total identification N Percent N Percent N Percent Number of persons in Lower class 136 100.0% 0 0.0% 136 100.0% household Working class 636 100.0% 0 0.0% 636 100.0% Middle class 661 100.0% 0 0.0% 661 100.0% Upper class 57 100.0% 0.0% 57 100.0% Descriptives Subjective class identification Statistic Std. Error Number of persons in Lower class Mean 2.32 126 household 90% Confidence Interval for Lower Bound 2.12 Mean Upper Bound 2.53 5% Trimmed Mean 2.18 Median 2.00 Variance 2.146 Std. Deviation 1.465 Minimum Maximum 9 Range Interquartile Range Skewness 1.344 208 Kurtosis 2.488 413 Working class Mean 2.47 .056 90% Confidence Interval for Lower Bound 2.38 Mean Upper Bound 2.56 5% Trimmed Mean 2.36 Median 2.00 Variance 1.982 Std. Deviation 1.408 Minimum Maximum 11 Range 10 Interquartile Range 2 Skewness 1.243 097 Kurtosis 2.440 194 Middle class Mean 2.26 .048 90% Confidence Interval for Lower Bound 2.18 Mean Upper Bound 2.34 5% Trimmed Mean 2.15 Median 2.00 Variance 1.517 Std. Deviation 1.232 Minimum Maximum 9 Range 8 Interquartile Range Skewness 1.452 .095 Kurtosis 3.215 190 Upper class Mean 2.21 169 90% Confidence Interval for Lower Bound 1.93 Mean Upper Bound 2.49 5% Trimmed Mean 2.08 Med 2.00Median 2.00 Variance 1.633 Std. Deviation 1.278 Minimum Maximum Range 6 Interquartile Range 2 Skewness 1.557 316 Kurtosis 2.774 623

Step by Step Solution

There are 3 Steps involved in it

1 Expert Approved Answer
Step: 1 Unlock blur-text-image
Question Has Been Solved by an Expert!

Get step-by-step solutions from verified subject matter experts

Step: 2 Unlock
Step: 3 Unlock

Students Have Also Explored These Related Mathematics Questions!