

Question: Case Processing Summary Cases Valid Missing Total N Percent N Percent N Percent Store Zone* Clothing Brand 700 70.0% 300 30.0% 1000 100.0% Purchased Store
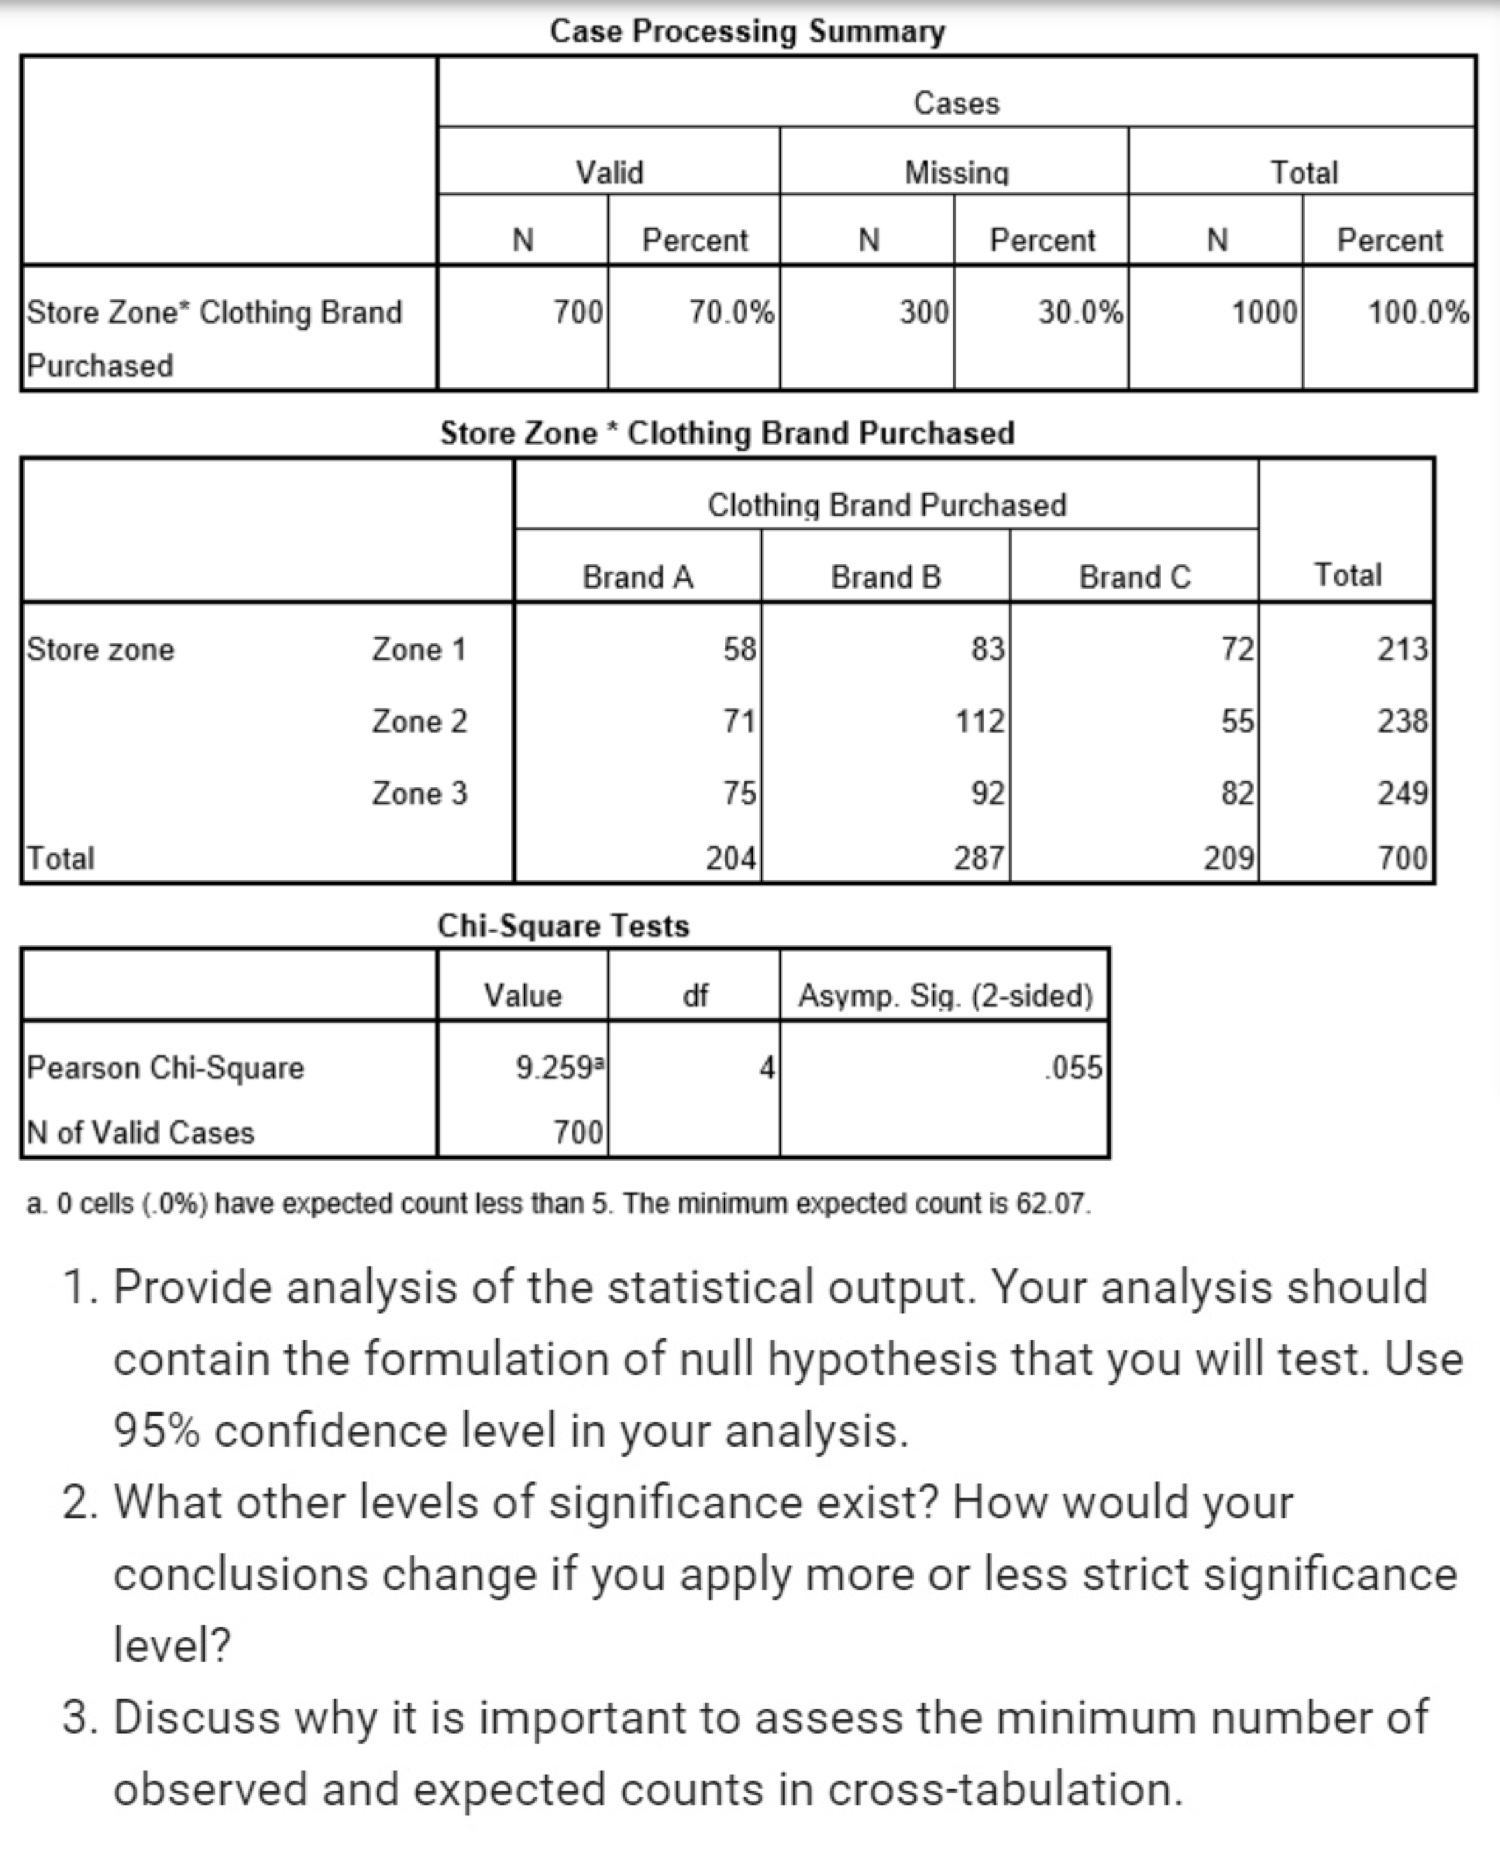
Case Processing Summary Cases Valid Missing Total N Percent N Percent N Percent Store Zone* Clothing Brand 700 70.0% 300 30.0% 1000 100.0% Purchased Store Zone * Clothing Brand Purchased Clothing Brand Purchased Brand A Brand B Brand C Total Store zone Zone 1 58 83 72 213 Zone 2 71 112 55 238 Zone 3 75 92 82 249 Total 204 287 209 700 Chi-Square Tests Value df Asymp. Sig. (2-sided) Pearson Chi-Square 9.2593 .055 N of Valid Cases 700 a. 0 cells (.0%) have expected count less than 5. The minimum expected count is 62.07. 1. Provide analysis of the statistical output. Your analysis should contain the formulation of null hypothesis that you will test. Use 95% confidence level in your analysis. 2. What other levels of significance exist? How would your conclusions change if you apply more or less strict significance level? 3. Discuss why it is important to assess the minimum number of observed and expected counts in cross-tabulation
Step by Step Solution
There are 3 Steps involved in it

Get step-by-step solutions from verified subject matter experts