

Question: How do you narrate frequency distribution from data on SPSS? Explore [DataSet]] C: Usersgalvi Downloadsappearance . sav Case Processing Summary Cases Valid Missing Total N
How do you narrate frequency distribution from data on SPSS?
![How do you narrate frequency distribution from data on SPSS? Explore [DataSet]]](https://s3.amazonaws.com/si.experts.images/answers/2024/07/668ab27aaef04_690668ab27a7507f.jpg)
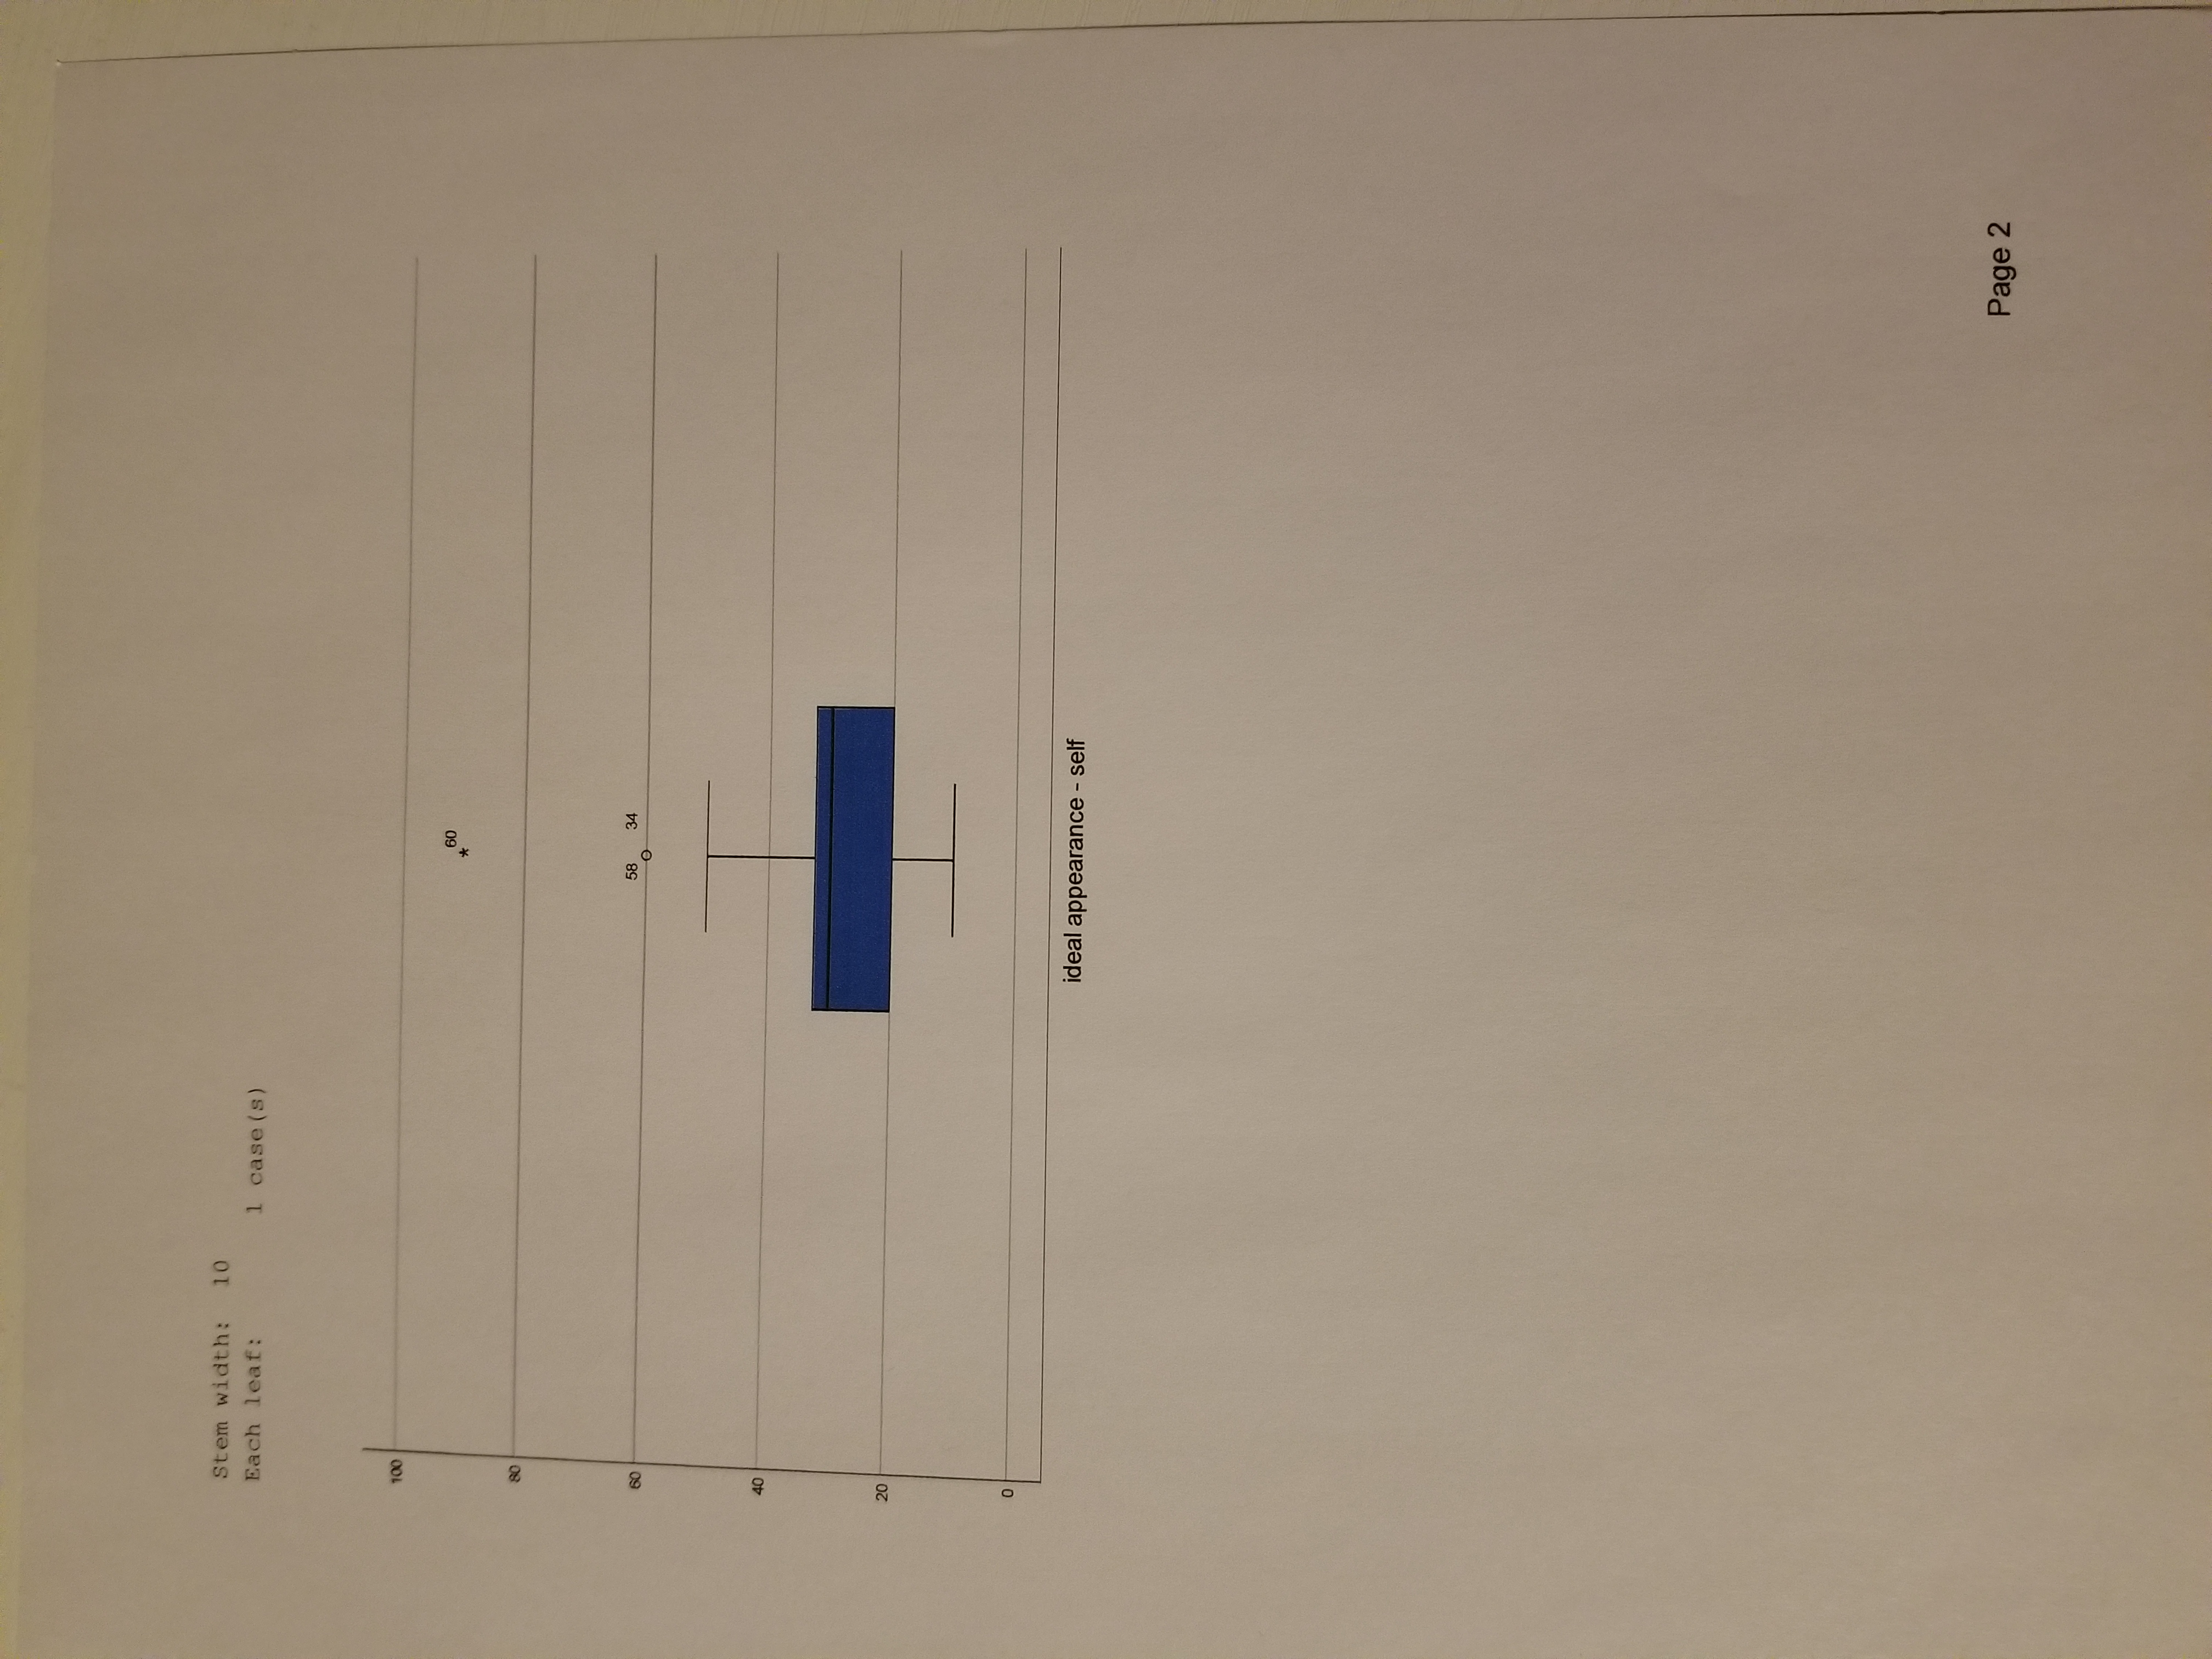
Explore [DataSet]] C: \\Users\\galvi \\Downloads\\appearance . sav Case Processing Summary Cases Valid Missing Total N Percent N Percent N Percent ideal appearance - self 71 100.0% 0 0.0% 71 100.0% Descriptives Statistic Std. Error ideal appearance - self Mean 31.11 1.517 95% Confidence Interval Lower Bound 28.09 for Mean Upper Bound 34. 14 5% Trimmed Mean 30.21 Median 30.00 Variance 163.387 Std. Deviation 12.782 Minimum 10 Maximum 90 Range 80 Interquartile Range 15 Skewness 1.714 .285 Kurtosis 5.625 563 ideal appearance - self ideal appearance - self Stem-and-Leaf Plot Frequency Stem & Leaf 3.00 000 00 18 .00 2 000000000000000012 2.00 2 57 30.00 3 0000000000000000000000000 0 0 0 0 0 1.00 3 5 8.00 00000004 1. 00 5 5.00 00000 3.00 Extremes (>= 60) Page 1
Step by Step Solution
There are 3 Steps involved in it

Get step-by-step solutions from verified subject matter experts