

Question: Case Study 13.1 You will need to determine a Project Performance Analysis OR CV/SV Calculations Review case study 13.1 (Page 293) and provide your answers
Case Study 13.1
You will need to determine a Project Performance Analysis OR CV/SV Calculations
Review case study 13.1 (Page 293) and provide your answers for the calculations only.
Formulas:
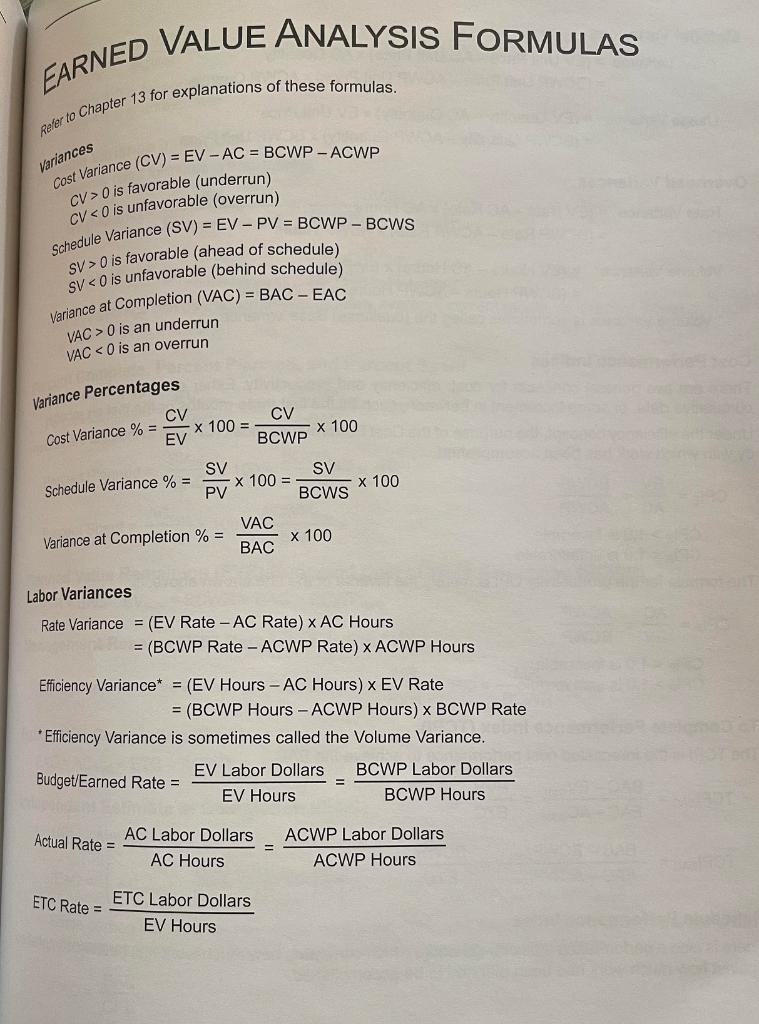
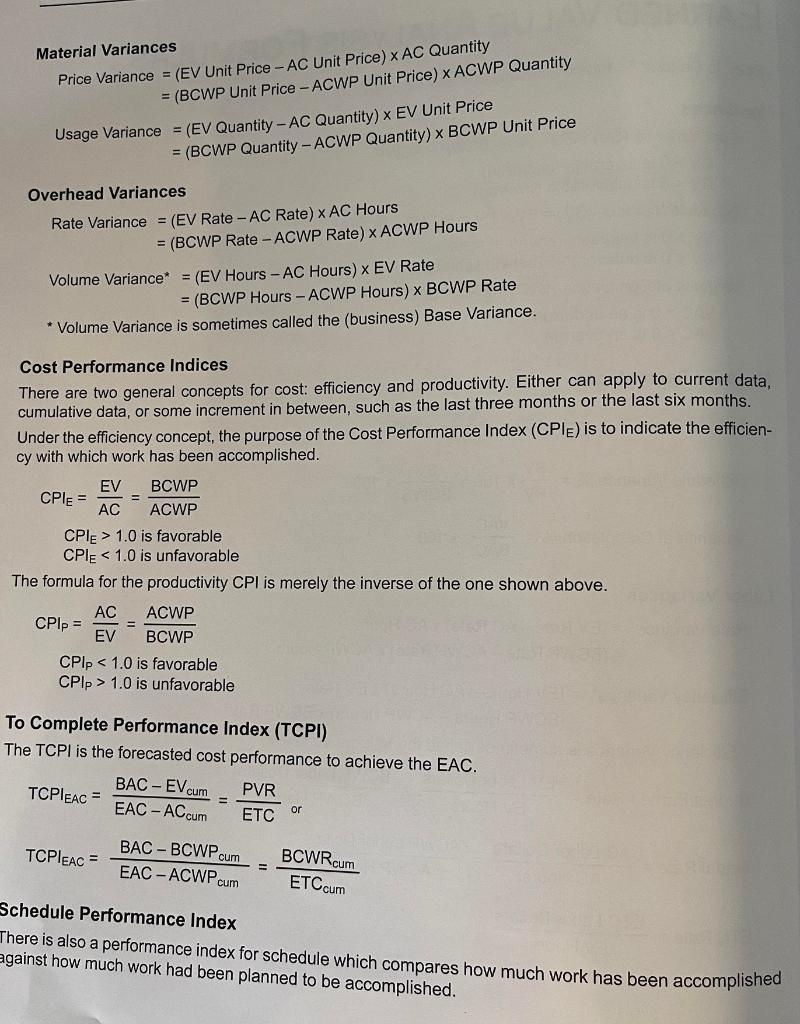
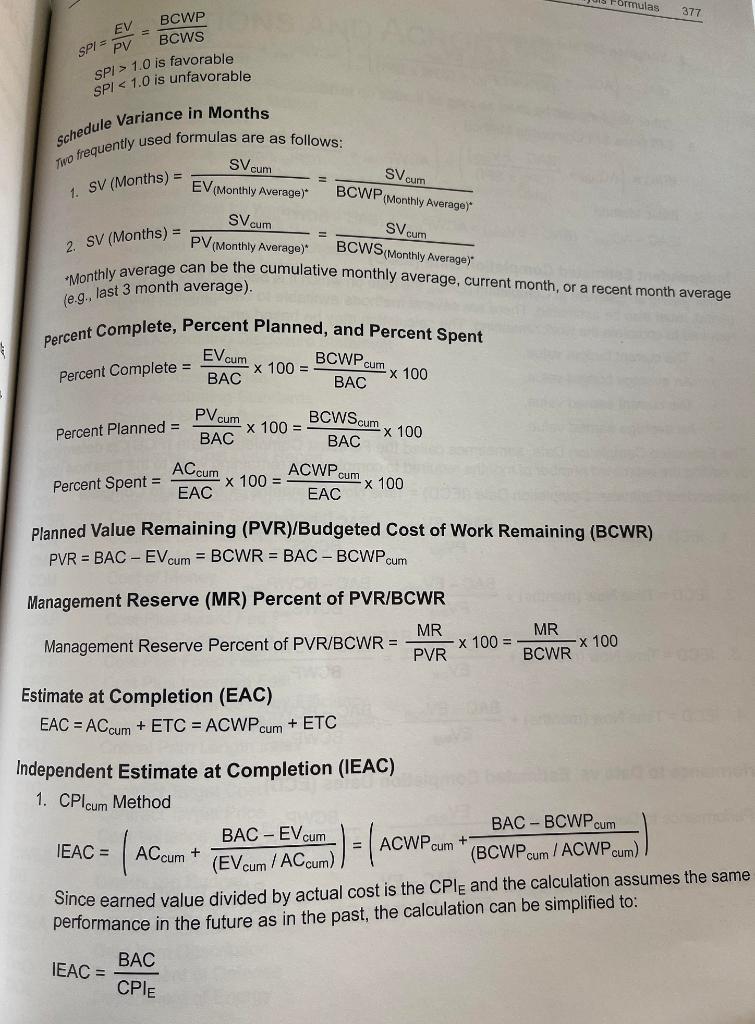
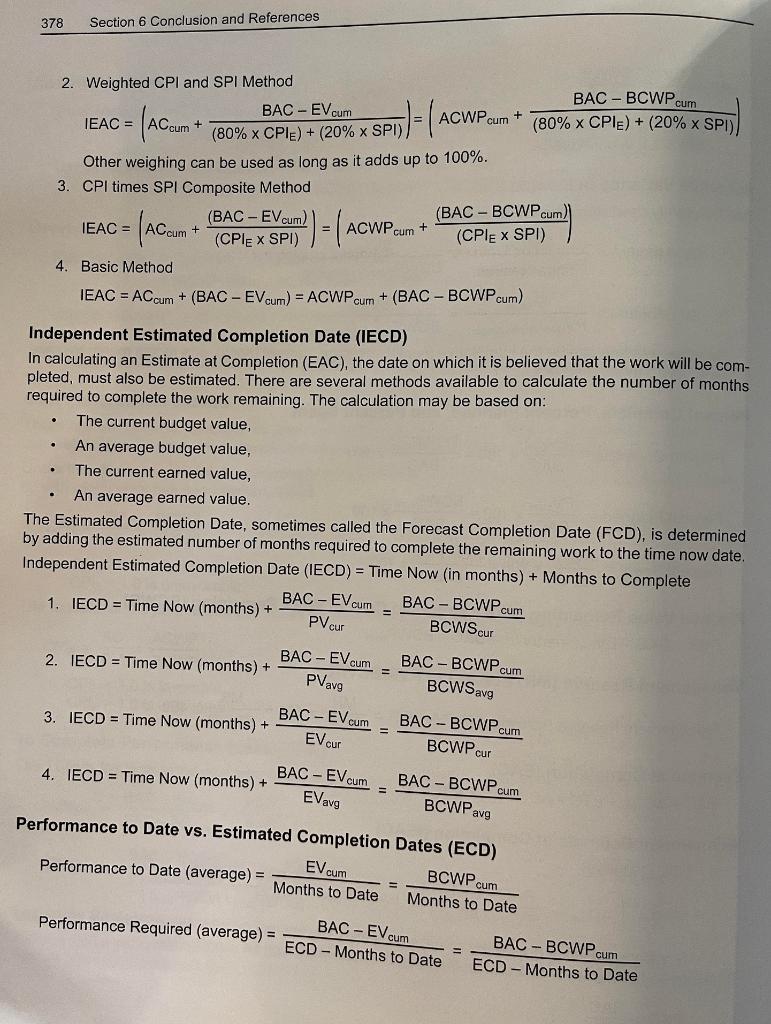
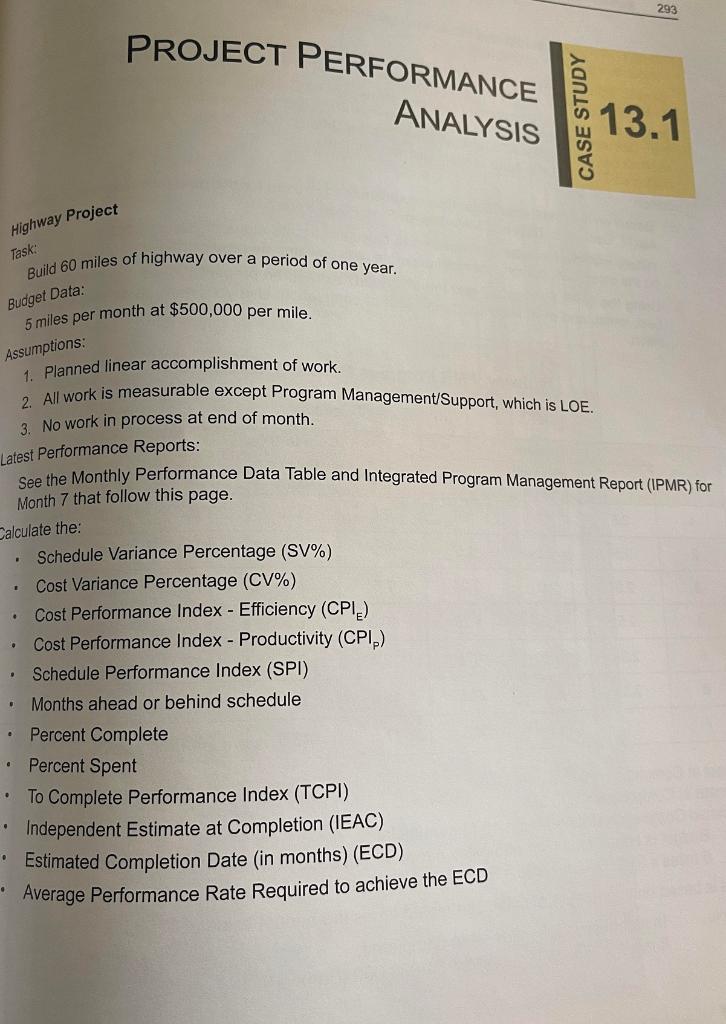
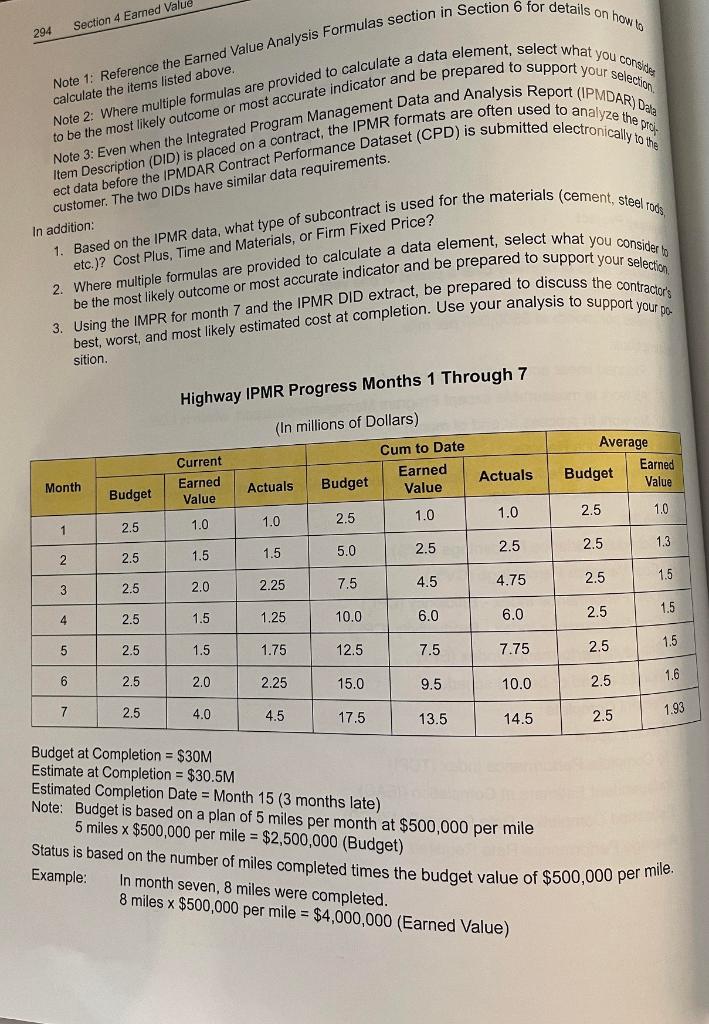
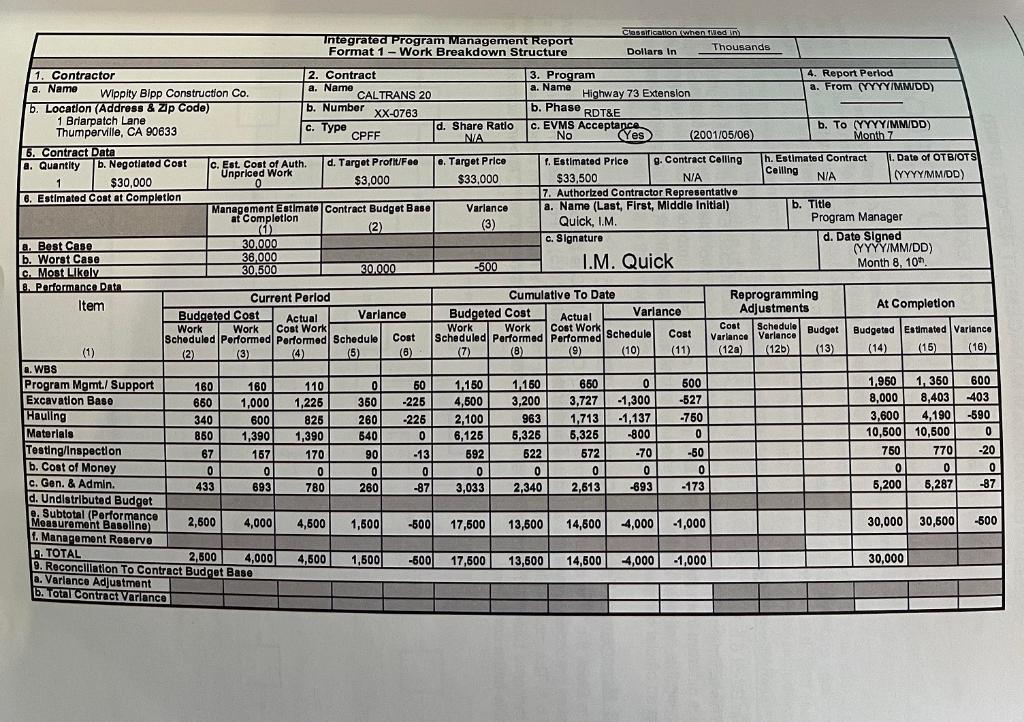
293 PROJECT PERFORMANCE ANALYSIS CASE STUDY 13.1 Highway Project Task: Build 60 miles of highway over a period of one year. Budget Data: 5 miles per month at $500,000 per mile. Assumptions: . . 1. Planned linear accomplishment of work. 2. All work is measurable except Program Management Support, which is LOE. 3. No work in process at end of month. Latest Performance Reports: See the Monthly Performance Data Table and Integrated Program Management Report (IPMR) for Month 7 that follow this page. Calculate the: Schedule Variance Percentage (SV%) Cost Variance Percentage (CV%) Cost Performance Index - Efficiency (CPI) Cost Performance Index - Productivity (CPI) Schedule Performance Index (SPI) Months ahead or behind schedule Percent Complete Percent Spent To Complete Performance Index (TCPI) Independent Estimate at Completion (IEAC) Estimated Completion Date (in months) (ECD) Average Performance Rate Required to achieve the ECD . . . . . 294 Section 4 Eamed Value calculate the items listed above. Note 1: Reference the Earned Value Analysis Formulas section in Section 6 for details on how to Note 2: Where multiple formulas are provided to calculate a data element, select what you can to be the most likely outcome or most accurate indicator and be prepared to support your selection Note 3: Even when the integrated Program Management Data and Analysis Report (IPMDAR) da Item Description (DID) is placed on a contract, the IPMR formats are often used to analyze the wo ect data before the IPMDAR Contract Performance Dataset (CPD) is submitted electronically to te customer. The two DIDs have similar data requirements. In addition: etc.)? Cost Plus, Time and Materials, or Firm Fixed Price? 1. Based on the IPMR data, what type of subcontract is used for the materials (cement, steel Tous 2. Where multiple formulas are provided to calculate a data element, select what you consider to be the most likely outcome or most accurate indicator and be prepared to support your selection 3. Using the IMPR for month 7 and the IPMR DID extract, be prepared to discuss the contractor's best, worst, and most likely estimated cost at completion. Use your analysis to support your o sition Highway IPMR Progress Months 1 Through 7 (In millions of Dollars) Cum to Date Earned Value Current Earned Value Average Earned Budget Value Actuals Month Actuals Budget Budget 1.0 1.0 2.5 1.0 1.0 2.5 1 1.0 2.5 2.5 2.5 1.3 1.5 5.0 2.5 1.5 2.5 2 1.5 2.5 4.5 4.75 3 2.5 2.25 7,5 2.0 + 1.5 2.5 4 1.5 1.25 10.0 2.5 6.0 6.0 1.5 5 2.5 1.5 1.75 12.5 7.5 2.5 7.75 1.6 6 2.5 2.0 2.25 15.0 9.5 10.0 2.5 7 2.5 4.0 1.93 4.5 17.5 13.5 14.5 2.5 Budget at Completion = $30M Estimate at Completion = $30.5M Estimated Completion Date = Month 15 (3 months late) Note: Budget is based on a plan of 5 miles per month at $500,000 per mile 5 miles x $500,000 per mile = $2,500,000 (Budget) Status is based on the number of miles completed times the budget value of $500,000 per mile. Example: In month seven, 8 miles were completed. 8 miles x $500,000 per mile = $4,000,000 (Earned Value) a. Name CALTRANS 20 b. Phase RDT&E Classification when I Integrated Program Management Report Format 1 - Work Breakdown Structure Thousands Dollars in 1. Contractor 2. Contract 3. Program 4. Report Period a. Name Wippity Blpp Construction Co. a a. Name Highway 73 Extension a. From (YYYYIMMDD) b. Location (Address & zip Codo) b. Number XX-0763 1 Briarpatch Lane Thumperville, CA 90633 . d. Share Ratio C. EVMS Acceptance b. To (YYYY/MM/DD) CPFF NA No (Yes (2001/05/06) Month 7 6. Contract Data a. Quantity b. Negotiated Cost c. Est. Cost of Auth. d. Target Profit/Fee e. Target Price f. Estimated Price g. Contract Ceiling h. Estimated Contract 1. Date of OTBIOTS Unpriced Work Celling $30,000 0 $3,000 $33,000 $33,500 N/A N/A (YYYY/MM/DD) 6. Estimated cost at Completion 7. Authorized Contractor Representative Management Entimate Contract Budget Base Varlance a. Name (Last, First, Middle Initial) b. Title at Completion (1) Program Manager (2) (3) Quick, I.M. 2. Best Case 30.000 c. Signature d. Date Signed b. Worst Case 36,000 (YYYY/MM/DD) I.M. Quick c. Most Likely 30.500 30.000 -500 Month 8, 10h B. Performance Data Current Period Cumulative To Date Item Reprogramming Budgeted Cost At Completion Varlance Actual Adjustments Budgeted Cost Varlance Actual Work Work Cost Work Work Cost Work Cost Scheduled Performed Performed Schedule Cost Scheduled Performed Performed Schedule Cost Variance Variance Budget Budgeted Estimated Variance (1) (2) (3) (4) (5) (8) (8) (9) (10) (11) (120) (126) (13) (14) (15) (16) a. WBS Program Mgmt./ Support 160 160 110 0 50 1,150 1,150 650 0 500 1,950 1,360 600 Excavation Baso 660 1,000 1,226 350 -225 4,500 3,200 -1,300 -527 8,000 8,403 -403 Hauling 340 600 826 260 -226 2,100 963 1,713 -1,137 -750 3,600 4,190 -590 Materials 850 1,390 1,390 640 0 0 6,125 5,326 5,326 -800 0 10,500 10,500 0 Testing/Inspection 67 157 170 90 -13 592 622 572 -70 -50 750 770 -20 b. Cost of Money 0 0 0 0 0 0 0 0 0 0 0 0 0 c. Gen. & Admin. 433 693 780 260 -871 3,033 2,340 2,613 -693 -173 5,200 6,287 -87 d. Undistributed Budget e. Subtotal (Performance Measurement Baseline) 2,600 4,000 4,500 1,500 -500 17,500 13,500 14,500 4,000 -1,000 30,000 30,500 -500 1. Management Reserve 9. TOTAL 2,600 9. Reconciliation To Contract Budget Baso 4,000 4,500 1,500 -5001 17,500 13,500 14,500 4,000 -1.000 30,000 a. Variance Adjustment 6. Total contract Variance Worked Schedule 3,727 EARNED VALUE ANALYSIS FORMULAS Refer to Chapter 13 for explanations of these formulas. variances Cost Variance (CV) = EV-AC = BCWP - ACWP cv> 0 is favorable (underrun) CV O is favorable (ahead of schedule) SV O is an underrun VAC 1.0 is favorable CPIE 1.0 is unfavorable = To Complete Performance Index (TCPI) The TCPI is the forecasted cost performance to achieve the EAC. BAC - EV cum PVR TCPIEAC = EAC - ACcum ETC or TCPIEAC = BAC - BCWP cum EAC-ACWP cum BCWR cum ETCcum Schedule Performance Index There is also a performance index for schedule which compares how much work has been accomplished against how much work had been planned to be accomplished. Formulas 377 SPI = EV BCWP PV BCWS SPI > 1.0 is favorable SPI 0 is favorable (underrun) CV O is favorable (ahead of schedule) SV O is an underrun VAC 1.0 is favorable CPIE 1.0 is unfavorable = To Complete Performance Index (TCPI) The TCPI is the forecasted cost performance to achieve the EAC. BAC - EV cum PVR TCPIEAC = EAC - ACcum ETC or TCPIEAC = BAC - BCWP cum EAC-ACWP cum BCWR cum ETCcum Schedule Performance Index There is also a performance index for schedule which compares how much work has been accomplished against how much work had been planned to be accomplished. Formulas 377 SPI = EV BCWP PV BCWS SPI > 1.0 is favorable SPI
Step by Step Solution
There are 3 Steps involved in it

Get step-by-step solutions from verified subject matter experts