

Question: Case Study 2 - Sales Vs Revenues Due Date March 1 2 ? t h @ 1 1 : 5 9 PM Via Canvas During
Case Study Sales Vs Revenues
Due Date March @ : PM Via Canvas
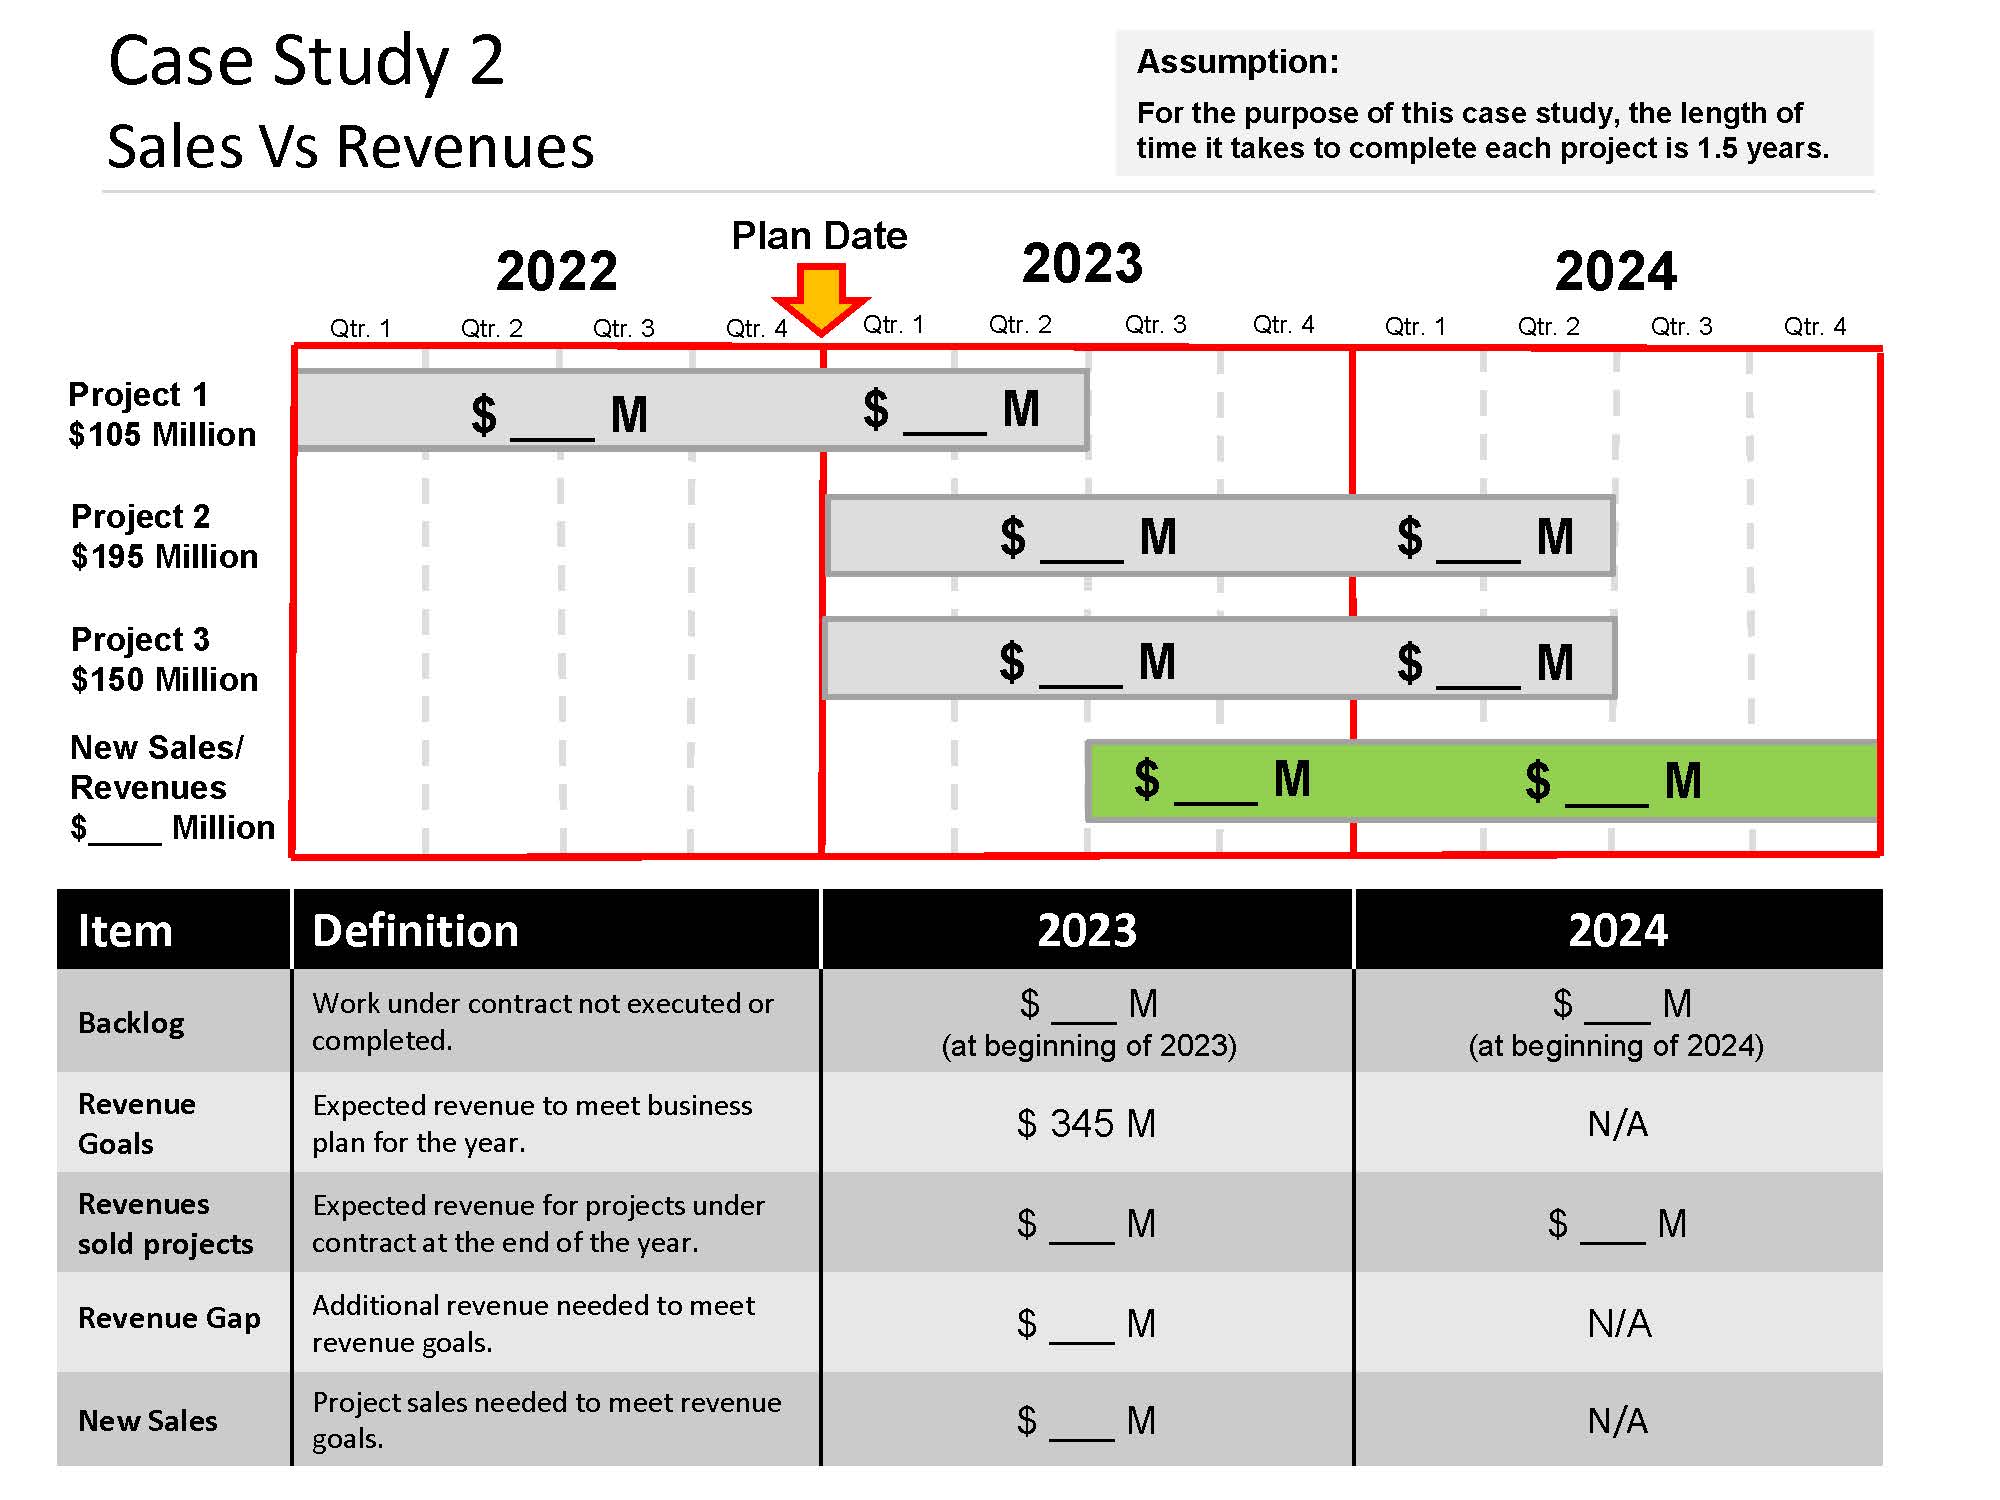
During the last sales and management meeting the leadership agrees there is a need to increase
the company revenues to $ Million for fiscal year As the business developer, you have
been asked to determine how much sales are needed to achieve the expected revenue
goal for the company. The company has a $ Million in identified opportunities "Pipeline" that
you could chase to achieve this goal and the company win rate is
Following the concepts discussed in class and using attached graph, please provide answers in
the spaces provided. This document is provided in PDF Form format so you can enter the values
for each of your answers. Please note the following assumptions and considerations,
All numbers are provided in millions of dollars.
Total cost for projects have been provided.
Average project length to complete is years.
Millions
Once completed, answer the following questions,
What is your observation regarding the relationship between revenues and sales?
How does your backlog affect the sales goals?
How does the "Burn Ratio" or expected project duration "schedule" impact your revenue goals?
Given the company's win ratio and revenue goal for how much volume of opportunities
the firm needs to pursue to achieve the expected revenue goal?
Is the firm's "pipeline" sufficient to reach the company goals?
Step by Step Solution
There are 3 Steps involved in it
1 Expert Approved Answer
Step: 1 Unlock

Question Has Been Solved by an Expert!
Get step-by-step solutions from verified subject matter experts
Step: 2 Unlock
Step: 3 Unlock