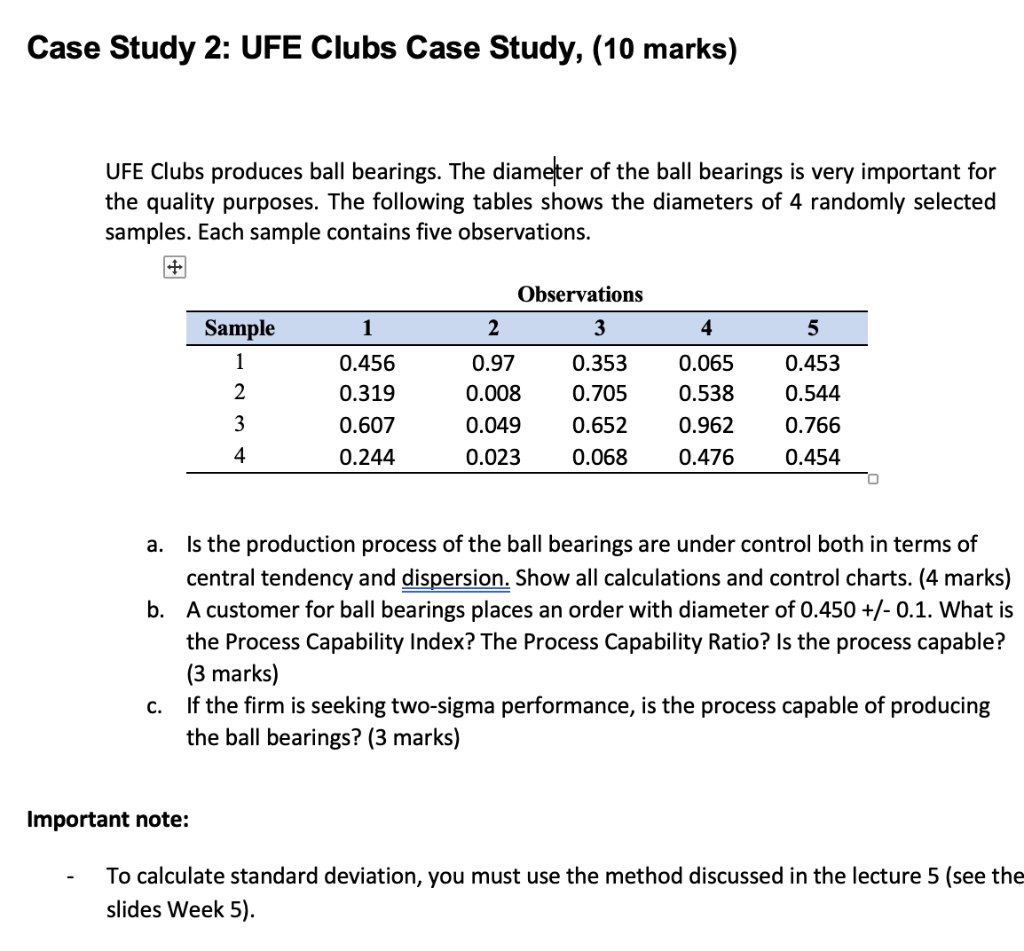
Question: Case Study 2: UFE Clubs Case Study, (10 marks) UFE Clubs produces ball bearings. The diameter of the ball bearings is very important for the

Case Study 2: UFE Clubs Case Study, (10 marks)Case Study 2: UFE Clubs Case Study, (10 marks)Case Study 2: UFE Clubs Case Study, (10 marks)Case Study 2: UFE Clubs Case Study, (10 marks)

Case Study 2: UFE Clubs Case Study, (10 marks) UFE Clubs produces ball bearings. The diameter of the ball bearings is very important for the quality purposes. The following tables shows the diameters of 4 randomly selected samples. Each sample contains five observations. Observations 1 2 3 4 5 Sample 1 2 0.456 0.319 0.607 0.244 0.97 0.008 0.049 0.023 0.353 0.705 0.652 0.068 0.065 0.538 0.962 0.476 0.453 0.544 0.766 0.454 3 4 a. Is the production process of the ball bearings are under control both in terms of central tendency and dispersion. Show all calculations and control charts. (4 marks) b. A customer for ball bearings places an order with diameter of 0.450 +/-0.1. What is the Process Capability Index? The Process Capability Ratio? Is the process capable? (3 marks) If the firm is seeking two-sigma performance, is the process capable of producing the ball bearings? (3 marks) C. Important note: To calculate standard deviation, you must use the method discussed in the lecture 5 (see the slides Week 5). Case Study 2: UFE Clubs Case Study, (10 marks) UFE Clubs produces ball bearings. The diameter of the ball bearings is very important for the quality purposes. The following tables shows the diameters of 4 randomly selected samples. Each sample contains five observations. Observations 1 2 3 4 5 Sample 1 2 0.456 0.319 0.607 0.244 0.97 0.008 0.049 0.023 0.353 0.705 0.652 0.068 0.065 0.538 0.962 0.476 0.453 0.544 0.766 0.454 3 4 a. Is the production process of the ball bearings are under control both in terms of central tendency and dispersion. Show all calculations and control charts. (4 marks) b. A customer for ball bearings places an order with diameter of 0.450 +/-0.1. What is the Process Capability Index? The Process Capability Ratio? Is the process capable? (3 marks) If the firm is seeking two-sigma performance, is the process capable of producing the ball bearings? (3 marks) C. Important note: To calculate standard deviation, you must use the method discussed in the lecture 5 (see the slides Week 5). X-Bar Chart: Control Limits (unknown standard deviation) Used to monitor the central tendency of a process X-chart Control Limits = UCL = x+AZ = LCL- = x - A R where A2 = a control chart factor based on sample size n: see next slide Establishing Control Limits (known standard deviation). x bar chart Upper control limit (UCL): = + zo7 Lower control limit (LCL): zoz where or = olln Standard deviation of distribution of sample means o = Estimate of the process standard deviation Sample size z = The number of standard deviations that control limits are based on = Average of sample means n =

Step by Step Solution

There are 3 Steps involved in it

1 Expert Approved Answer
Step: 1 Unlock blur-text-image
Question Has Been Solved by an Expert!

Get step-by-step solutions from verified subject matter experts

Step: 2 Unlock
Step: 3 Unlock

Students Have Also Explored These Related General Management Questions!