Question: Case Study 3 Part 2 Parti ACME continues to complain to your sales team about late deliveries. As any good quality engineer, you have already
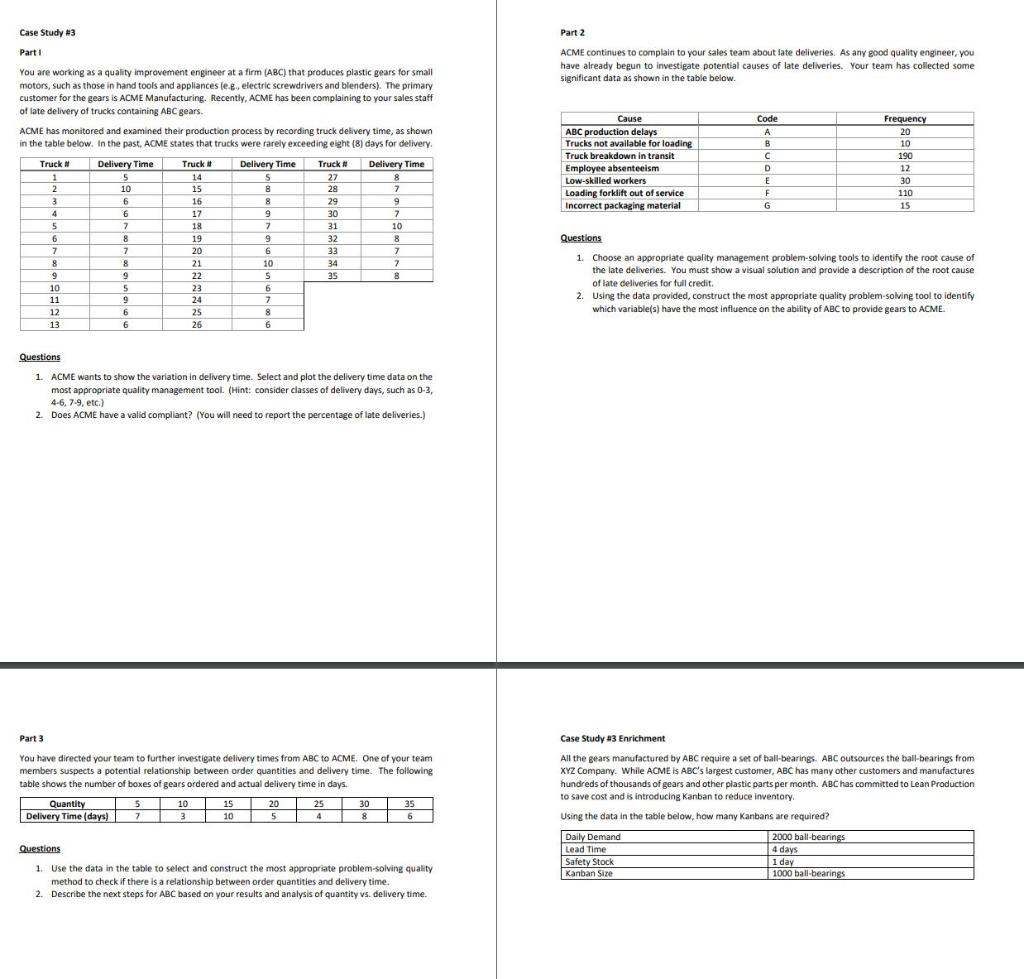
Case Study 3 Part 2 Parti ACME continues to complain to your sales team about late deliveries. As any good quality engineer, you have already begun to investigate potential causes of late deliveries. Your team has collected some significant data as shown in the table below. You are working as a quality improvement engineer at a firm (ABC) that produces plastic gears for small motors, such as those in hand tools and appliances lee. electric screwdrivers and blenders). The primary customer for the gears is ACME Manufacturing. Recently, ACME has been complaining to your sales staff of late delivery of trucks containing ABC gears. Code Frequency 20 A ACME has monitored and examined their production process by recording truck delivery time, as shown in the table below. In the past, ACME states that trucks were rarely exceeding eight (8) days for delivery B 10 c 190 Truck Truck # Truck # Delivery Time D Cause ABC production delays Trucks not available for loading Truck breakdown in transit Employee absenteeism Low-skilled workers Loading forklift out of service Incorrect packaging material 12 Delivery Time 5 10 1 2 14 Delivery Time 5 8 27 28 8 7 E 30 15 F 110 3 6 16 8 29 9 G 15 17 9 30 7 4 5 6 7 7 19 7 31 10 6 8 19 9 32 8 Questions 7 7 20 6 33 7 8 8 21 10 34 7 9 9 22 5 35 8 10 1. Choose an appropriate quality management problem-solving tools to identify the root cause of the late deliveries. You must show a visual solution and provide a description of the root cause of late deliveries for full credit 2. Using the data provided, construct the most appropriate quality problem-solving tool to identify which variable(s) have the most influence on the ability of ABC to provide gears to ACME. 5 9 23 24 6 7 11 12 6 25 8 13 6 26 6 Questions 1. ACME wants to show the variation in delivery time. Select and plot the delivery time data on the most appropriate quality management tool. (Hint: consider classes of delivery days, such as 0-3, 4-6, 7-9, etc.) 2. Does ACME have a valid compliant? (You will need to report the percentage of late deliveries.) Part 3 Case Study #3 Enrichment You have directed your team to further investigate delivery times from ABC to ACME. One of your team members suspects a potential relationship between order quantities and delivery time. The following table shows the number of boxes of gears ordered and actual delivery time in days. All the gears manufactured by ABC require a set of ball bearings. ABC outsources the ball bearings from XYZ Company. While ACME is ABC's largest customer, ABC has many other customers and manufactures hundreds of thousands of gears and other plastic parts per month. ABC has committed to Lean Production to save cost and is introducing Kanban to reduce inventory. 5 15 20 25 Quantity Delivery Time (days) ) 35 10 3 30 8 7 10 5 6 Using the data in the table below, how many Kanbans are required? Questions Daily Demand Lead Time Safety Stock Kanban Size 2000 ball bearings 4 days 1 day 1000 ball bearings 1. Use the data in the table to select and construct the most appropriate problem-solving quality method to check if there is a relationship between order quantities and delivery time. 2. Describe the next steps for ABC based on your results and analysis of quantity vs. delivery time. Case Study 3 Part 2 Parti ACME continues to complain to your sales team about late deliveries. As any good quality engineer, you have already begun to investigate potential causes of late deliveries. Your team has collected some significant data as shown in the table below. You are working as a quality improvement engineer at a firm (ABC) that produces plastic gears for small motors, such as those in hand tools and appliances lee. electric screwdrivers and blenders). The primary customer for the gears is ACME Manufacturing. Recently, ACME has been complaining to your sales staff of late delivery of trucks containing ABC gears. Code Frequency 20 A ACME has monitored and examined their production process by recording truck delivery time, as shown in the table below. In the past, ACME states that trucks were rarely exceeding eight (8) days for delivery B 10 c 190 Truck Truck # Truck # Delivery Time D Cause ABC production delays Trucks not available for loading Truck breakdown in transit Employee absenteeism Low-skilled workers Loading forklift out of service Incorrect packaging material 12 Delivery Time 5 10 1 2 14 Delivery Time 5 8 27 28 8 7 E 30 15 F 110 3 6 16 8 29 9 G 15 17 9 30 7 4 5 6 7 7 19 7 31 10 6 8 19 9 32 8 Questions 7 7 20 6 33 7 8 8 21 10 34 7 9 9 22 5 35 8 10 1. Choose an appropriate quality management problem-solving tools to identify the root cause of the late deliveries. You must show a visual solution and provide a description of the root cause of late deliveries for full credit 2. Using the data provided, construct the most appropriate quality problem-solving tool to identify which variable(s) have the most influence on the ability of ABC to provide gears to ACME. 5 9 23 24 6 7 11 12 6 25 8 13 6 26 6 Questions 1. ACME wants to show the variation in delivery time. Select and plot the delivery time data on the most appropriate quality management tool. (Hint: consider classes of delivery days, such as 0-3, 4-6, 7-9, etc.) 2. Does ACME have a valid compliant? (You will need to report the percentage of late deliveries.) Part 3 Case Study #3 Enrichment You have directed your team to further investigate delivery times from ABC to ACME. One of your team members suspects a potential relationship between order quantities and delivery time. The following table shows the number of boxes of gears ordered and actual delivery time in days. All the gears manufactured by ABC require a set of ball bearings. ABC outsources the ball bearings from XYZ Company. While ACME is ABC's largest customer, ABC has many other customers and manufactures hundreds of thousands of gears and other plastic parts per month. ABC has committed to Lean Production to save cost and is introducing Kanban to reduce inventory. 5 15 20 25 Quantity Delivery Time (days) ) 35 10 3 30 8 7 10 5 6 Using the data in the table below, how many Kanbans are required? Questions Daily Demand Lead Time Safety Stock Kanban Size 2000 ball bearings 4 days 1 day 1000 ball bearings 1. Use the data in the table to select and construct the most appropriate problem-solving quality method to check if there is a relationship between order quantities and delivery time. 2. Describe the next steps for ABC based on your results and analysis of quantity vs. delivery time


