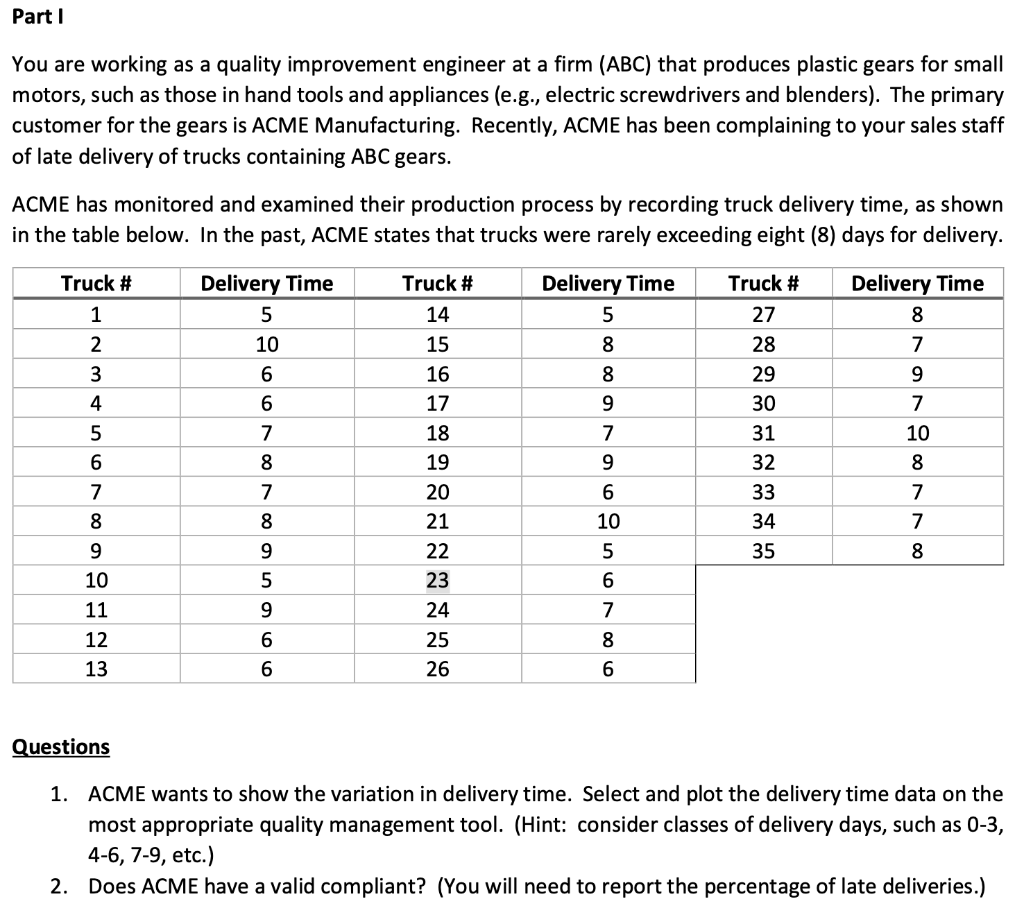
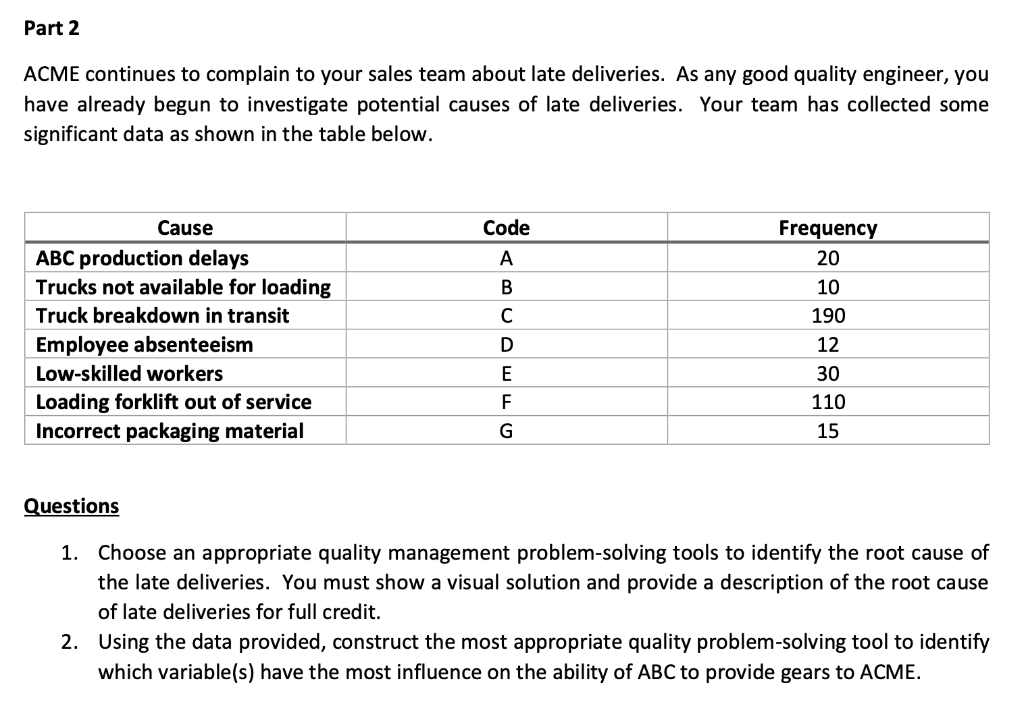
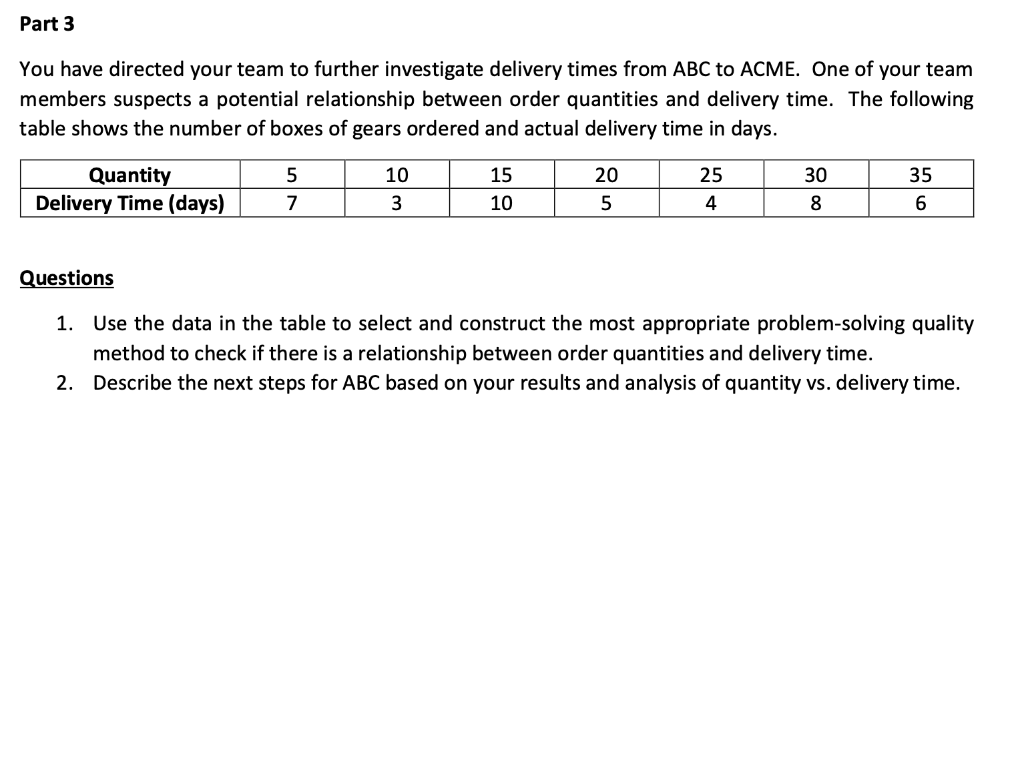
Question: You are working as a quality improvement engineer at a firm (ABC) that produces plastic gears for small motors, such as those in hand tools

You are working as a quality improvement engineer

You are working as a quality improvement engineer

You are working as a quality improvement engineer

You are working as a quality improvement engineer at a firm (ABC) that produces plastic gears for small motors, such as those in hand tools and appliances (e.g., electric screwdrivers and blenders). The primary customer for the gears is ACME Manufacturing. Recently, ACME has been complaining to your sales staff of late delivery of trucks containing ABC gears. ACME has monitored and examined their production process by recording truck delivery time, as shown in the table below. In the past, ACME states that trucks were rarely exceeding eight (8) days for delivery. Questions 1. ACME wants to show the variation in delivery time. Select and plot the delivery time data on the most appropriate quality management tool. (Hint: consider classes of delivery days, such as 03, 4-6, 7-9, etc.) 2. Does ACME have a valid compliant? (You will need to report the percentage of late deliveries.) ACME continues to complain to your sales team about late deliveries. As any good quality engineer, you have already begun to investigate potential causes of late deliveries. Your team has collected some significant data as shown in the table below. Questions 1. Choose an appropriate quality management problem-solving tools to identify the root cause of the late deliveries. You must show a visual solution and provide a description of the root cause of late deliveries for full credit. 2. Using the data provided, construct the most appropriate quality problem-solving tool to identify which variable(s) have the most influence on the ability of ABC to provide gears to ACME. You have directed your team to further investigate delivery times from ABC to ACME. One of your team members suspects a potential relationship between order quantities and delivery time. The following table shows the number of boxes of gears ordered and actual delivery time in days. Questions 1. Use the data in the table to select and construct the most appropriate problem-solving quality method to check if there is a relationship between order quantities and delivery time. 2. Describe the next steps for ABC based on your results and analysis of quantity vs. delivery time

Step by Step Solution

There are 3 Steps involved in it

1 Expert Approved Answer
Step: 1 Unlock blur-text-image
Question Has Been Solved by an Expert!

Get step-by-step solutions from verified subject matter experts

Step: 2 Unlock
Step: 3 Unlock

Students Have Also Explored These Related General Management Questions!