Question: CASE STUDY - EXTENDING A CLIENT RECORD MANAGEMENT SYSTEM A client record management system working in one sector of government was to be extended w
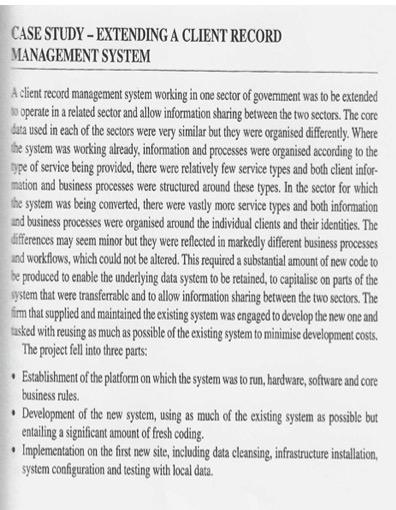
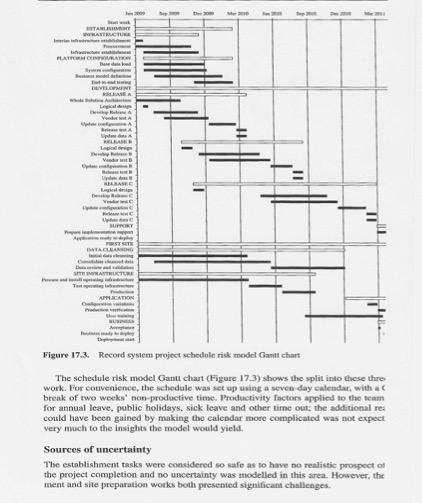
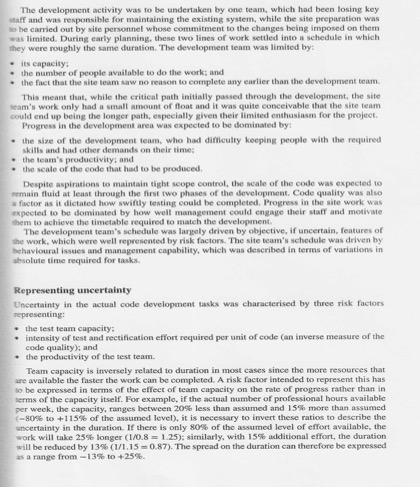
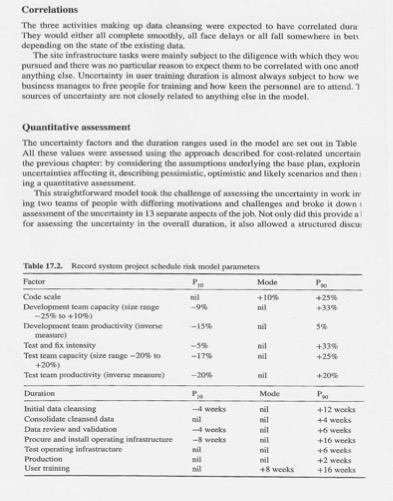
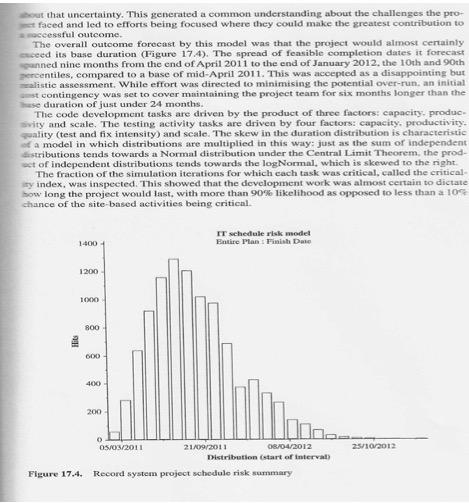
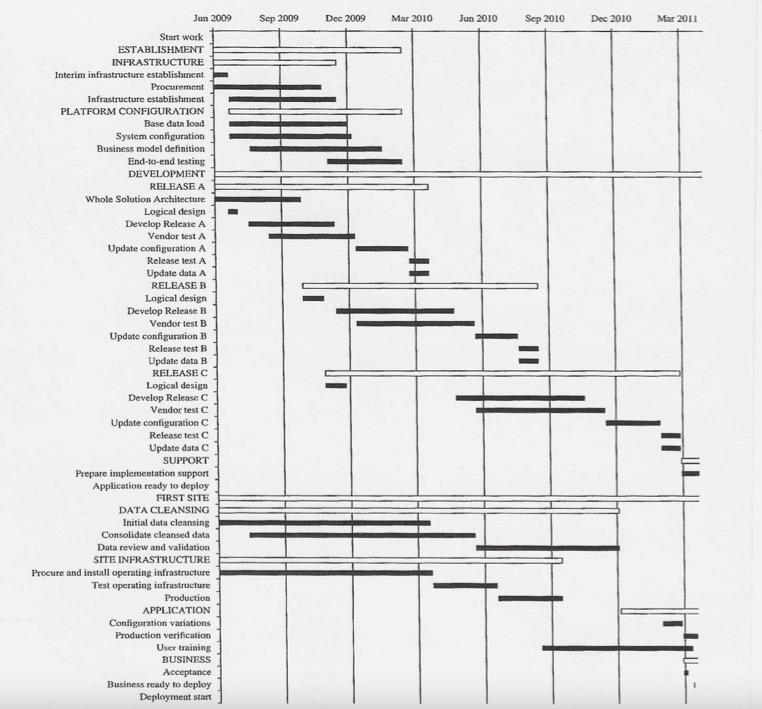
CASE STUDY - EXTENDING A CLIENT RECORD MANAGEMENT SYSTEM A client record management system working in one sector of government was to be extended w operate in a related sector and allow information sharing between the two sectors. The core data used in each of the sectors were very similar but they were organised differently. Where the system was working already, information and processes were organised according to the type of service being provided, there were relatively few service types and both client infor- mation and business processes were structured around these types. In the sector for which the system was being converted, there were vastly more service types and both information und business processes were organised around the individual clients and their identities. The differences may seem minor but they were reflected in markedly different business processes and workflows, which could not be altered. This required a substantial amount of new code to be produced to enable the underlying data system to be retained to capitalise on parts of the system that were transferable and to allow information sharing between the two sectors. The firm that supplied and maintained the existing system was engaged to develop the new one and tasked with reusing as much as possible of the existing system to minimise development costs. The project fell into three parts: Establishment of the platform on which the system was to run, hardware, software and core business rules. Development of the new system, using as much of the existing system as possible but entailing a significant amount of fresh coding. Implementation on the first new site, including data cleansing, infrastructure installation, system configuration and testing with local data. . INTARIS WWEAVERUCTURE RATORA VELOS Vond BA 11 w Lapin WC SUPONY POST ISATA CLEAR SANTUTURE AUCATION www They Figure 17.3. Record system project schedule risk model Gantt Chart The schedule risk model Gantt chart (Figure 173) shows the split into these thre work. For convenience, the schedule was set up using a seven day calendar with ac break of two weeks non productive time. Productivity factors applied to the team for annual leave, public holidays. sick leave and other time out the additional res could have been gained by making the calendar more complicated was not expect very much to the insights the model would yield. Sources of uncertainty The establishment tasks were considered so safe as to have no realistie prospect of the project completion and no uncertainty was modelled in this area. However, the ment and site preparation works both presented significant challenges The development activity was to be undertaken by one team, which had been losing key alf and was responsible for maintaining the existing system, while the site preparation was he carried out by site personnel whose commitment to the changes being imposed on them was limited. During early planning these two lines of work settled into schedule in which they were roughly the same duration. The development team was limited by its capacity: the number of people available to do the works and the fact that the site toam saw no reason to complete any earlier than the development team This meant that while the critical path initially passed through the development, the site eam's work only had a small amount of float and it was quite conceivable that the site team could end up being the longer path, especially given their limited enthusiasm for the project Progress in the development area was expected to be dominated by the size of the development team, who had difficulty koeping people with the required skills and had other demands on their time the team's productivity, and the scale of the code that had to be produced Despite aspirations to maintain tight scope control, the sale of the code was expected to main fuld at least through the first two phases of the development. Code quality was also factor as it dictated how swiftly testing could be completed Progress in the site work was expected to be dominated by how well management could engage their staff and motivate em to achieve the timetable required to match the development The development team's schedule was largely driven by objective, if uncertain, features of the work, which were well represented by risk factors. The site team's schedule was driven by Shavioural issues and management capability, which was described in terms of variations in bsolute time required for tasks Representing uncertainty Uncertainty in the actual code development tasks was characterised by three risk factors representing the test team cupacity: intensity of test and rectification effort required per unit of code on inverse measure of the code quality, and the productivity of the test team. Team capacity is inversely related to duration in most cases since the more resources that ure available the faster the work can be completed. A risk factor intended to represent this has to be expressed in terms of the effect of team capacity on the rate of progress rather than in terms of the capacity itself. For example, if the actual number of professional hours available per week, the capacity, ranges between 20% less than assumed and 15% more than assumed (-80% to +115% of the assumed level), it is necessary to invert these ratios to describe the uncertainty in the duration. If there is only 80% of the assumed level of effort available, the work will take 25% longer (1/0.8 1.25): similarly, with 15% additional effort, the duration will be reduced by 13% (1/1.150.87). "The spread on the duration can therefore be expressed as a range from -13% to +25% Correlations The three activities making up data cleansing were expected to have correlated dur They would either all complete smoothly, all face delays or all fall somewhere in bet depending on the state of the existing data The site infrastructure tasks were mainly subject to the diligence with which they wou pursued and there was no particular reason to expect them to be correlated with one anoth anything else. Uncertainty in user training duration is almost always subject to how we business manages to free people for training and how keen the personnel are to attend. sources of uncertainty are not closely related to anything else in the model Quantitative Assessment The uncertainty factors and the duration ranges used in the model are set out in Table All these values were assessed using the approach described for cost-related uncertain the previous chapters by considering the sumptions underlying the base plan, explorin uncertainties affecting it, describing pessimistic optimistic and likely scenarios and then ing a quantitative asement This straightforward model took the challenge of sessing the uncertainty in work in ing two teams of people with differing motivations and challenges and broke it down Sement of the uncertainty in 13 separate aspects of the job. Not only did this provides for assessing the uncertainty in the overall duration, it also allowed a structured discu +255 +335 5% +33% +254 Table 17.2. Record system project chedule risk model parameters Mode Code scale mil +10 Development team capacity lae range wil -25 10+10%) Development team productivity invene -15% nil mestre) Test and fix intensity Test team capacity (slenge -205 to -17 +209) Test scam productivity (imene mere) Duration Mode Initial data cleansing -- works Consolidate cleaned data nil Data review and validation -4 weeks nil Procure and install operating infrastructure -8 weeks Test operating infrastructure Production User training + 8 weeks +205 1.7117113 Po +12 wocks + wecks +6 weeks +16 weeks +6 weeks +2 weeks +16 weeks nil out that uncertainty. This generated a common understanding about the challenges the pro- faced and led to efforts being focused where they could make the greatest contribution to accessful outcome. The overall outcome forecast by this model was that the project would almost certainly succed its base duration (Figure 17.4). The spread of feasible completion dates it forecast panned nine months from the end of April 2011 to the end of January 2012, the 10th and 90th zercentiles, compared to a base of mid-April 2011. This was accepted as a disappointing but listic assessment. While effort was directed to minimising the potential over-run, an initial st contingency was set to cover maintaining the project team for six months longer than the se duration of just under 24 months. The code development tasks are driven by the product of three factors: capacity, produce Svity and scale. The testing activity tasks are driven by four factors: capacity, productivity wwality (test and fix intensity) and scale. The skew in the duration distribution is characteristic a model in which distributions are multiplied in this way: just as the sum of independent distributions tends towards a Normal distribution under the Central Limit Theorem, the prod- oct of independent distributions tends towards the log Normal, which is skewed to the right The fraction of the simulation iterations for which cach task was critical, called the critical ity index, was inspected. This showed that the development work was almost certain to dictate how long the project would last, with more than 90% likelihood as opposed to less than a 10% chance of the site-based activities being critical IT schedule risk model Entre Plan: Fini Dar 1-400 1200 TO 800 Hits 000 400 200 25/10/2012 OS/03/2011 21/09/2011 08/04/2012 Distribution start of interval Record system project schedule risk summary Figure 17.4. Jun 2009 Sep 2009 Dec 2009 Mar 2010 Jun 2010 Sep 2010 Dec 2010 Mar 2011 Start work ESTABLISHMENT INFRASTRUCTURE Interim infrastructure establishment Procurement Infrastructure establishment PLATFORM CONFIGURATION Base data load System configuration Business model definition End-to-end testing DEVELOPMENT RELEASE A Whole Solution Architecture Logical design Develop Release A Vendor test A Update configuration A Release test A Update data A RELEASEB Logical design Develop Release B Vendor test B Update configuration B Release test B Update data B RELEASEC Logical design Develop Release C Vendor test Update configuration C Release test Update data C SUPPORT Prepare implementation support Application ready to deploy FIRST SITE DATA CLEANSING Initial data cleansing Consolidate cleansed data Data review and validation SITE INFRASTRUCTURE Procure and install operating infrastructure Test operating infrastructure Production APPLICATION Configuration variations Production verification User training BUSINESS Acceptance Business ready to deploy Deployment start CASE STUDY - EXTENDING A CLIENT RECORD MANAGEMENT SYSTEM A client record management system working in one sector of government was to be extended w operate in a related sector and allow information sharing between the two sectors. The core data used in each of the sectors were very similar but they were organised differently. Where the system was working already, information and processes were organised according to the type of service being provided, there were relatively few service types and both client infor- mation and business processes were structured around these types. In the sector for which the system was being converted, there were vastly more service types and both information und business processes were organised around the individual clients and their identities. The differences may seem minor but they were reflected in markedly different business processes and workflows, which could not be altered. This required a substantial amount of new code to be produced to enable the underlying data system to be retained to capitalise on parts of the system that were transferable and to allow information sharing between the two sectors. The firm that supplied and maintained the existing system was engaged to develop the new one and tasked with reusing as much as possible of the existing system to minimise development costs. The project fell into three parts: Establishment of the platform on which the system was to run, hardware, software and core business rules. Development of the new system, using as much of the existing system as possible but entailing a significant amount of fresh coding. Implementation on the first new site, including data cleansing, infrastructure installation, system configuration and testing with local data. . INTARIS WWEAVERUCTURE RATORA VELOS Vond BA 11 w Lapin WC SUPONY POST ISATA CLEAR SANTUTURE AUCATION www They Figure 17.3. Record system project schedule risk model Gantt Chart The schedule risk model Gantt chart (Figure 173) shows the split into these thre work. For convenience, the schedule was set up using a seven day calendar with ac break of two weeks non productive time. Productivity factors applied to the team for annual leave, public holidays. sick leave and other time out the additional res could have been gained by making the calendar more complicated was not expect very much to the insights the model would yield. Sources of uncertainty The establishment tasks were considered so safe as to have no realistie prospect of the project completion and no uncertainty was modelled in this area. However, the ment and site preparation works both presented significant challenges The development activity was to be undertaken by one team, which had been losing key alf and was responsible for maintaining the existing system, while the site preparation was he carried out by site personnel whose commitment to the changes being imposed on them was limited. During early planning these two lines of work settled into schedule in which they were roughly the same duration. The development team was limited by its capacity: the number of people available to do the works and the fact that the site toam saw no reason to complete any earlier than the development team This meant that while the critical path initially passed through the development, the site eam's work only had a small amount of float and it was quite conceivable that the site team could end up being the longer path, especially given their limited enthusiasm for the project Progress in the development area was expected to be dominated by the size of the development team, who had difficulty koeping people with the required skills and had other demands on their time the team's productivity, and the scale of the code that had to be produced Despite aspirations to maintain tight scope control, the sale of the code was expected to main fuld at least through the first two phases of the development. Code quality was also factor as it dictated how swiftly testing could be completed Progress in the site work was expected to be dominated by how well management could engage their staff and motivate em to achieve the timetable required to match the development The development team's schedule was largely driven by objective, if uncertain, features of the work, which were well represented by risk factors. The site team's schedule was driven by Shavioural issues and management capability, which was described in terms of variations in bsolute time required for tasks Representing uncertainty Uncertainty in the actual code development tasks was characterised by three risk factors representing the test team cupacity: intensity of test and rectification effort required per unit of code on inverse measure of the code quality, and the productivity of the test team. Team capacity is inversely related to duration in most cases since the more resources that ure available the faster the work can be completed. A risk factor intended to represent this has to be expressed in terms of the effect of team capacity on the rate of progress rather than in terms of the capacity itself. For example, if the actual number of professional hours available per week, the capacity, ranges between 20% less than assumed and 15% more than assumed (-80% to +115% of the assumed level), it is necessary to invert these ratios to describe the uncertainty in the duration. If there is only 80% of the assumed level of effort available, the work will take 25% longer (1/0.8 1.25): similarly, with 15% additional effort, the duration will be reduced by 13% (1/1.150.87). "The spread on the duration can therefore be expressed as a range from -13% to +25% Correlations The three activities making up data cleansing were expected to have correlated dur They would either all complete smoothly, all face delays or all fall somewhere in bet depending on the state of the existing data The site infrastructure tasks were mainly subject to the diligence with which they wou pursued and there was no particular reason to expect them to be correlated with one anoth anything else. Uncertainty in user training duration is almost always subject to how we business manages to free people for training and how keen the personnel are to attend. sources of uncertainty are not closely related to anything else in the model Quantitative Assessment The uncertainty factors and the duration ranges used in the model are set out in Table All these values were assessed using the approach described for cost-related uncertain the previous chapters by considering the sumptions underlying the base plan, explorin uncertainties affecting it, describing pessimistic optimistic and likely scenarios and then ing a quantitative asement This straightforward model took the challenge of sessing the uncertainty in work in ing two teams of people with differing motivations and challenges and broke it down Sement of the uncertainty in 13 separate aspects of the job. Not only did this provides for assessing the uncertainty in the overall duration, it also allowed a structured discu +255 +335 5% +33% +254 Table 17.2. Record system project chedule risk model parameters Mode Code scale mil +10 Development team capacity lae range wil -25 10+10%) Development team productivity invene -15% nil mestre) Test and fix intensity Test team capacity (slenge -205 to -17 +209) Test scam productivity (imene mere) Duration Mode Initial data cleansing -- works Consolidate cleaned data nil Data review and validation -4 weeks nil Procure and install operating infrastructure -8 weeks Test operating infrastructure Production User training + 8 weeks +205 1.7117113 Po +12 wocks + wecks +6 weeks +16 weeks +6 weeks +2 weeks +16 weeks nil out that uncertainty. This generated a common understanding about the challenges the pro- faced and led to efforts being focused where they could make the greatest contribution to accessful outcome. The overall outcome forecast by this model was that the project would almost certainly succed its base duration (Figure 17.4). The spread of feasible completion dates it forecast panned nine months from the end of April 2011 to the end of January 2012, the 10th and 90th zercentiles, compared to a base of mid-April 2011. This was accepted as a disappointing but listic assessment. While effort was directed to minimising the potential over-run, an initial st contingency was set to cover maintaining the project team for six months longer than the se duration of just under 24 months. The code development tasks are driven by the product of three factors: capacity, produce Svity and scale. The testing activity tasks are driven by four factors: capacity, productivity wwality (test and fix intensity) and scale. The skew in the duration distribution is characteristic a model in which distributions are multiplied in this way: just as the sum of independent distributions tends towards a Normal distribution under the Central Limit Theorem, the prod- oct of independent distributions tends towards the log Normal, which is skewed to the right The fraction of the simulation iterations for which cach task was critical, called the critical ity index, was inspected. This showed that the development work was almost certain to dictate how long the project would last, with more than 90% likelihood as opposed to less than a 10% chance of the site-based activities being critical IT schedule risk model Entre Plan: Fini Dar 1-400 1200 TO 800 Hits 000 400 200 25/10/2012 OS/03/2011 21/09/2011 08/04/2012 Distribution start of interval Record system project schedule risk summary Figure 17.4. Jun 2009 Sep 2009 Dec 2009 Mar 2010 Jun 2010 Sep 2010 Dec 2010 Mar 2011 Start work ESTABLISHMENT INFRASTRUCTURE Interim infrastructure establishment Procurement Infrastructure establishment PLATFORM CONFIGURATION Base data load System configuration Business model definition End-to-end testing DEVELOPMENT RELEASE A Whole Solution Architecture Logical design Develop Release A Vendor test A Update configuration A Release test A Update data A RELEASEB Logical design Develop Release B Vendor test B Update configuration B Release test B Update data B RELEASEC Logical design Develop Release C Vendor test Update configuration C Release test Update data C SUPPORT Prepare implementation support Application ready to deploy FIRST SITE DATA CLEANSING Initial data cleansing Consolidate cleansed data Data review and validation SITE INFRASTRUCTURE Procure and install operating infrastructure Test operating infrastructure Production APPLICATION Configuration variations Production verification User training BUSINESS Acceptance Business ready to deploy Deployment start


