

Question: Case study Given the following balance sheet, income statement, historical ratios and industry averages, calculate the Pulp, Paper, and Paperboard, Inc. financial ratios for the
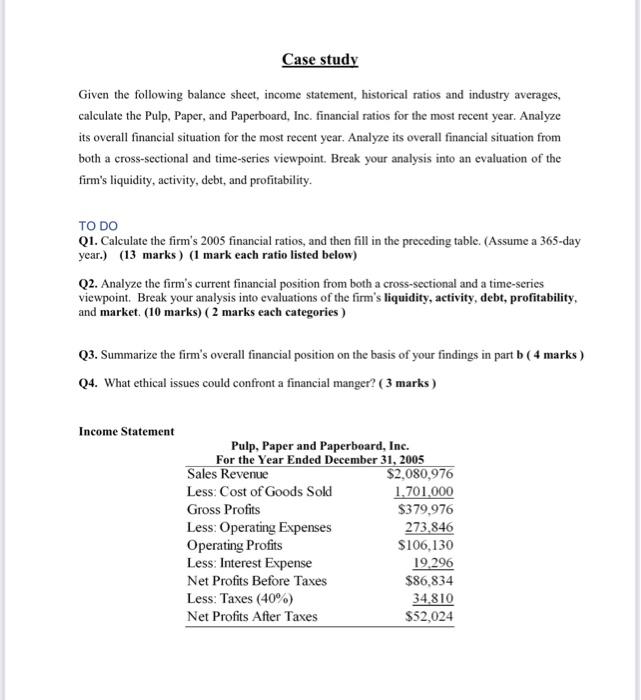
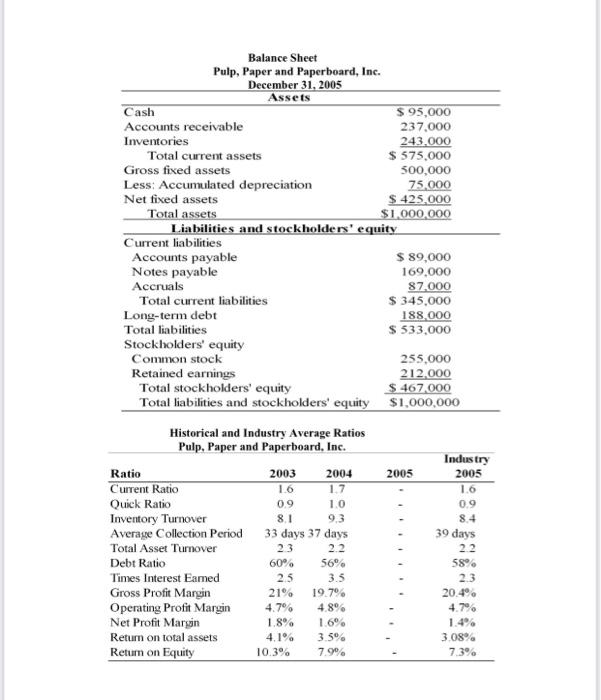
Case study Given the following balance sheet, income statement, historical ratios and industry averages, calculate the Pulp, Paper, and Paperboard, Inc. financial ratios for the most recent year. Analyze its overall financial situation for the most recent year. Analyze its overall financial situation from both a cross-sectional and time-series viewpoint. Break your analysis into an evaluation of the firm's liquidity, activity, debt, and profitability. TO DO Q1. Calculate the firm's 2005 financial ratios, and then fill in the preceding table. (Assume a 365-day year.) (13 marks) (1 mark each ratio listed below) Q2. Analyze the firm's current financial position from both a cross-sectional and a time-series viewpoint. Break your analysis into evaluations of the firm's liquidity, activity, debt, profitability, and market. (10 marks) (2 marks each categories ) Q3. Summarize the firm's overall financial position on the basis of your findings in part b ( 4 marks) Q4. What ethical issues could confront a financial manger? ( 3 marks) Income Statement Pulp, Paper and Paperboard, Inc. For the Year Ended December 31, 2005 Sales Revenue $2,080,976 Less: Cost of Goods Sold 1,701,000 Gross Profits $379,976 Less: Operating Expenses 273,846 Operating Profits $106,130 Less: Interest Expense 19.296 Net Profits Before Taxes $86,834 Less: Taxes (40%) 34.810 Net Profits After Taxes $52,024 Balance Sheet Pulp, Paper and Paperboard, Inc. December 31, 2005 Assets Cash $ 95,000 Accounts receivable 237.000 Inventories 243.000 Total current assets $ 575.000 Gross fixed assets 500,000 Less: Accumulated depreciation 75.000 Net fixed assets $ 425,000 Total assets $1,000,000 Liabilities and stockholders' equity Current liabilities Accounts payable $ 89,000 Notes payable 169,000 Accruals 87,000 Total current liabilities $ 345.000 Long-term debt 188,000 Total liabilities $ 533,000 Stockholders' equity Common stock 255,000 Retained earnings 212.000 Total stockholders' equity $ 467.000 Total liabilities and stockholders' equity $1,000,000 Historical and Industry Average Ratios Pulp, Paper and Paperboard. Inc. Industry Ratio 2003 2004 2005 2005 Current Ratio 1.6 1.7 1.6 Quick Ratio 09 1.0 0.9 Inventory Turnover 8.1 93 8.4 Average Collection Period 33 days 37 days 39 days Total Asset Turnover 23 22 Debt Ratio 60% 56% 58% Times Interest Eamed 25 3.5 23 Gross Profit Margin 21% 19.70 20.4% Operating Profit Margin 4.7% 4.8% 4.7% Net Profit Margin 1.8% 1.6% Return on total assets 4.1% 3.5 3.08% Return on Equity 10.3% 7.9% 7.3% 22
Step by Step Solution
There are 3 Steps involved in it

Get step-by-step solutions from verified subject matter experts