

Question: Im lost please help 12) Given the following balance sheet, income statement, historical ratios and industry averages, calculate the Pulp, Paper, and Paperboard, Inc, financial
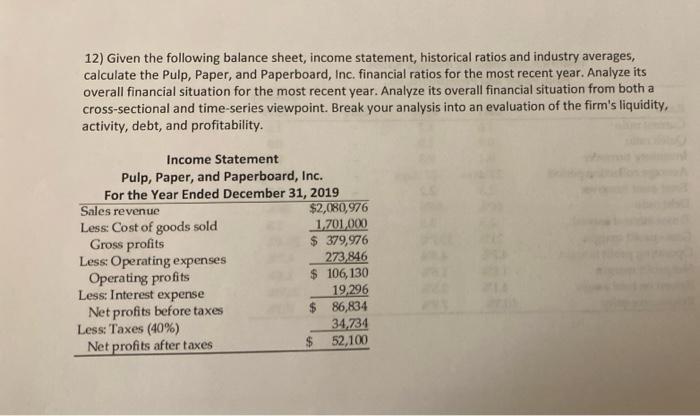
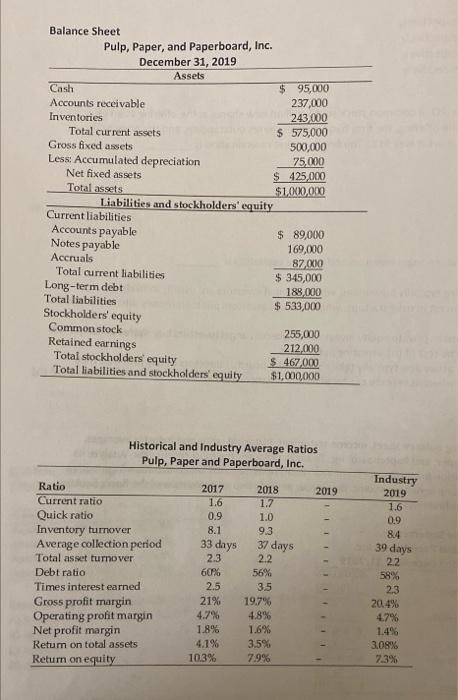
12) Given the following balance sheet, income statement, historical ratios and industry averages, calculate the Pulp, Paper, and Paperboard, Inc, financial ratios for the most recent year. Analyze its overall financial situation for the most recent year. Analyze its overall financial situation from both a cross-sectional and time-series viewpoint. Break your analysis into an evaluation of the firm's liquidity, activity, debt, and profitability. Income Statement Pulp, Paper, and Paperboard, Inc. For the Year Ended December 31, 2019 Sales revenue $2,080,976 Less: Cost of goods sold 1,701,000 Gross profits $ 379,976 Less Operating expenses 273,846 Operating profits 106, 130 Less: Interest expense 19,296 Net profits before taxes $ 86,834 Less: Taxes (40%) 34.734 Net profits after taxes $ 52,100 Balance Sheet Pulp, Paper, and Paperboard, Inc. December 31, 2019 Assets Cash $ 95,000 Accounts receivable 237,000 Inventories 243,000 Total current assets $575,000 Gross fixed assets 500,000 Less: Accumulated depreciation 75.000 Net fixed assets $ 425,000 Total assets $1,000,000 Liabilities and stockholders' equity Current liabilities Accounts payable $ 89,000 Notes payable 169,000 Accruals 87.000 Total current liabilities $ 345,000 Long-term debt 188,000 Total liabilities $ 533,000 Stockholders' equity Common stock 255,000 Retained earnings 212.000 Total stockholders equity $ 467 000 Total liabilities and stockholders' equity $1,000,000 Historical and Industry Average Ratios Pulp, Paper and Paperboard, Inc. 2019 2018 1.7 1.0 9.3 Industry 2019 1.6 0.9 84 III 37 days 39 days Ratio Current ratio Quick ratio Inventory tumover Average collection period Total asset turnover Debt ratio Times interest earned Gross profit margin Operating profit margin Net profit margin Retum on total assets Return on equity 2017 1.6 0.9 8.1 33 days 2.3 60% 2.5 21% 4.7% 1.8% 4.1% 10.3% 2.2 56% 3.5 19.7% 4.8% 1.6% 3.5% 7.9% 2.2 58% 23 20.4% 4.7% 1.4% 3.08% 7.3% NOTE: Use the equations we have used to calculate the 2019 financials and then write a narrative as stated in the question of comparing both Pulp, Paper and Paperboard's financials from a time series aspect (how is the trend over the 3 years of data) and also compare to the industry (cross-sectional 3 comparisons)
Step by Step Solution
There are 3 Steps involved in it

Get step-by-step solutions from verified subject matter experts