

Case Study: Google Inc.s Acquisition of AdMob; Questions 1,5 1. How do investors evaluate young technology companies
Question:
Case Study:
Google Inc.’s Acquisition of AdMob; Questions 1,5
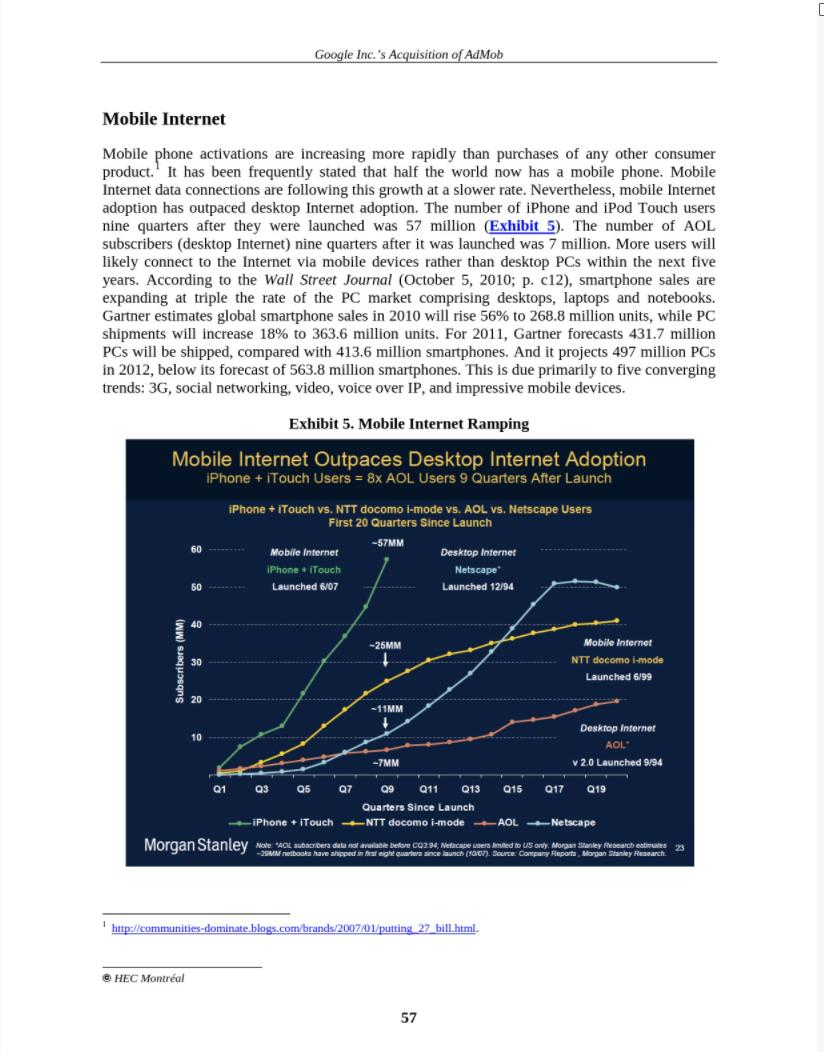
1. How do investors evaluate young technology companies such as Google and how do these
investor evaluations in turn impact management decisions? >> (Hint: Entrepreneurial value-based management framework).
5. How would you value AdMob at the end of 2009:
> as a stand-alone firm, (Hint: _ fill out the spreadsheet)
> as an acquisition target.
Spreadsheet:
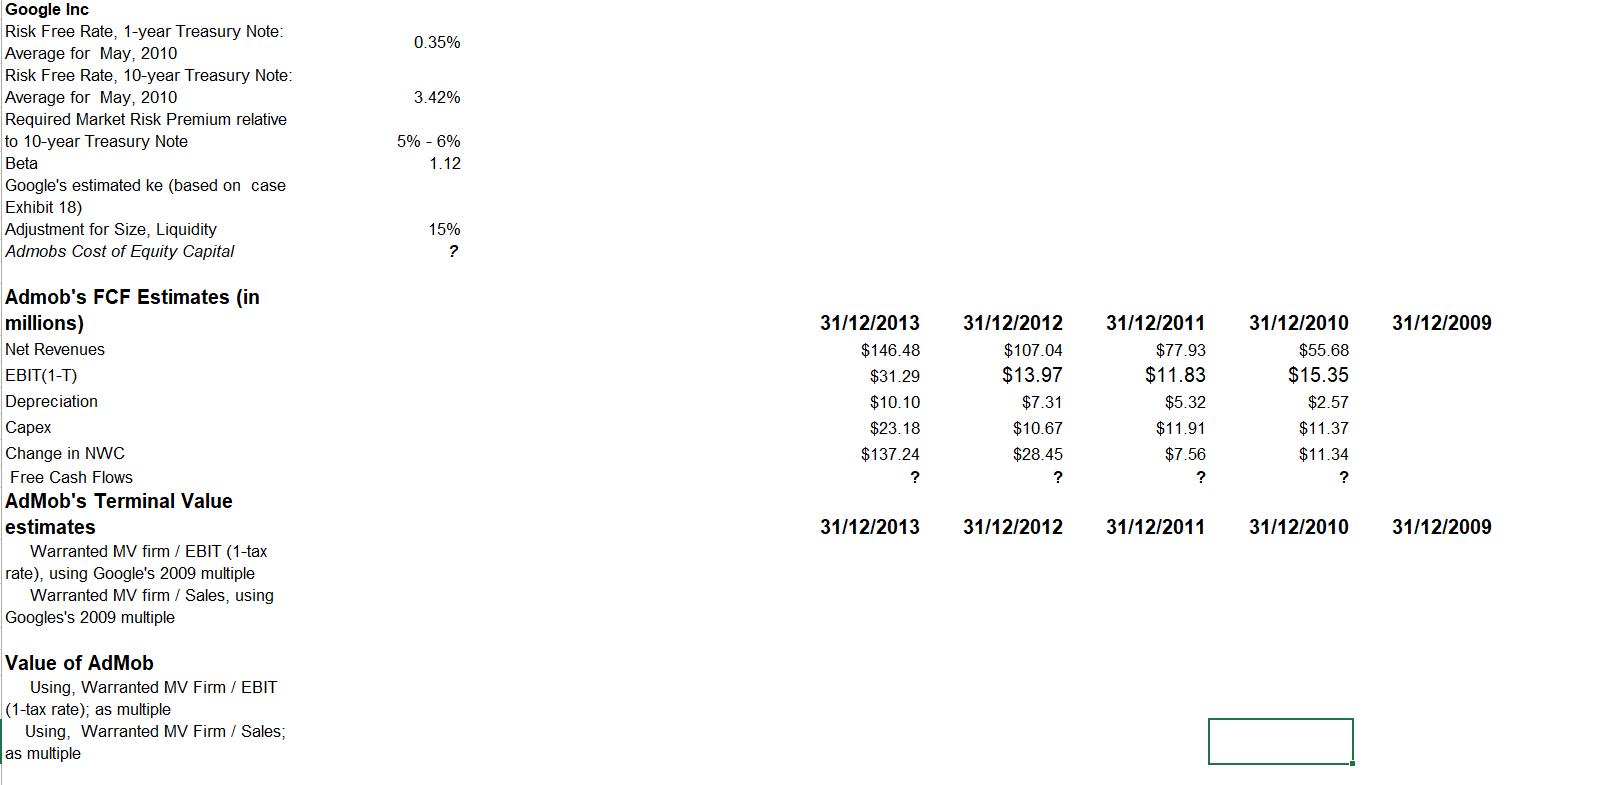
ijcsm INTERNATIONAL JOURNAL OF CASE STUDIES IN MANAGEMENT Google Inc. s Acquisition of AdMob Case prepared by Professor Nikhil VARAIYA¹ Volume 11 Issue 1 April 2013 Introduction On Monday, November 9, 2009, Google Inc. announced that it would purchase mobile advertising start-up AdMob in a stock-and-cash financed acquisition valued at $750 million. AdMob, founded in 2006, sells ads across thousands of websites that are tailored for mobile phones. It was one of the first companies to offer ads that run inside software for the Apple iPhone and devices that run Google s Android operating system. Mobile (phone) advertising spending is expected to constitute an increasing share of total online advertising spending. Along with other start-ups, AdMob competes with established players such as Google, Yahoo!, Bing and major cell phone carriers such as Sprint, AT&T and Verizon Wireless to offer and profit from mobile advertising. JP Morgan estimated AdMob s 2009 revenues at between $45 and $60 million. This suggests that Google s offer price for AdMob is a generous multiple of 12 to 17 times AdMob s estimated 2009 revenue. In a sign of increased acquisition activity, on Monday, January 5, 2010, Apple Inc. announced that it had acquired Quattro Wireless, a competitor of AdMob, for $275 million. It was reported that Apple too had earlier tried to acquire AdMob. The Wall Street Journal reported on April 7, 2010, that the Federal Trade Commission (FTC) was reviewing an anti-trust challenge to Google s proposed acquisition. Broadpoint Amtech analyst Brian Marshall stated, Clearly Apple and Google continue to run down parallel paths... it s all about mobile advertising on smartphones, they are trying to maximize the dollars they create online (Reuters, January 5, 2010). After conducting an intensive review, the FTC announced on Friday, May 21, 2010, that it had closed its investigation of Google s proposed. acquisition of AdMob, thereby clearing the way for Google s acquisition offer. Google has grown through both organic expansion and acquisition. Per data from Thomson- Reuters SDC database, Google completed well over 100 acquisitions between 2000 and 2010, worth an estimated total of $8.6 billion. More than 50% of the acquisition dollars were spent on target firms in the online advertising market. Google CFO Patrick Pichette recently described acquisitions as an accelerator for growth. He reiterated, So for M&A the mindset is to comb ¹Nikhil Varaiya is a Professor in the Department of Finance at San Diego State University, USA. ⒸHEC Montréal 2013 All rights reserved for all countries. Any translation or alteration in any form whatsoever is prohibited. The International Journal of Case Studies in Management is published on-line (www.hec.ca/revuedecas/en), ISSN 1911-2599. This case is intended to be used as the framework for an educational discussion and does not imply any judgement on the administrative situation presented. Deposited under number 9 20 2013 001 with the HEC Montréal Case Centre, 3000, chemin de la Côte-Sainte-Catherine, Montréal (Québec) Canada H3T 2A7. 49 the world constantly, given our agenda of development. If we find a piece that fits what we are going to do in 8 to 12 months-for example, we have a team of 6 and we know we need a team of 15, then M&A is an accelerator because it fits into a very clear plan of what we are trying to achieve (McKinsey Quarterly, August 2011). While acquisitions have historically been an important driver of growth for the acquiring firms, they can also pose considerable risk. In the typical acquisition of a publicly traded target firm, target shareholders reap considerable financial gains since such acquisitions occur at significant premiums to the target s pre-acquisition stock price, with premiums averaging 30 to 40%. However, the record for acquiring firm shareholders is mixed; the share prices of acquirers exhibit marginal increases on average following acquisition announcements, and assessing the long-run impacts of acquisitions is difficult as the time period following acquisition becomes longer. It has also been reported that more than half of all acquisitions fail to create value for the acquiring firms due primarily to post-merger integration failures. However, an issue is whether active acquirers such as Google are more likely to be successful at post-merger integration, thereby increasing significantly the likelihood of undertaking value-creating acquisitions. In its evaluation of young technology firms such as Google, the investment community places significant weight on the expected future growth rates of revenues and earnings of such firms. Such firms have historically exhibited high growth rates in terms of revenues, earnings and market capitalizations. Hence, the managements of these firms are very cognizant of the valuation implications of any divergences between their own internal growth forecasts and growth expectations of the external investment community. This growth dynamic can create a constant search for growth opportunities by managements of these firms. The table below contains data on Google s market capitalization, earnings and book value of equity for the period 12/31/2004 - 6/30/2010 (annual data through 2009; first two quarters of 2010); Google s IPO occurred in 2004. Market Value of Equity (billions) Book Value of Equity (billions) Earnings. (billions) PE Ratio (S&P 500) 12/31/04 $51.46 ⒸHEC Montréal $2.90 Google Inc. s Acquisition of AdMob $0.40 20.4 12/31/05 $122.93 $9.40 $1.46 18.7 12/31/06 $142.29 $17.04 $3.10 17.3 12/31/07 50 $216.37 $22.69 $4.20 18.9 12/31/08 $96.95 $28.24 $4.23 28.2 12/31/09 $197.01 $36.00 $6.50 53.8 6/30/10 $141.80 $40.61 $3.85 Google Inc. Google is a global technology company whose mission is to organize the world s information and make it universally accessible and useful. It maintains a large index of websites and other online content and makes this content freely available through its search engine to anyone on the Internet. Google s search technology helps people obtain nearly instant access to relevant online information. 16.8 Google Inc. s Acquisition of AdMob The online advertising industry is engaged in buying and selling advertising space on web pages that are accessed by viewers on the Internet; the Internet itself is accessed via desktop or laptop computers, smartphones and other mobile devices. The industry is often divided into: (i) search advertising that appears on search-results pages; (ii) display advertising that appears on non- search web pages; (iii) classified listings that appear on websites; and (iv) email-based advertisements. As of 2009, the distribution of ad spending across these categories indicates that search advertising dominates with a 47% share, followed by display advertising at 22%. The Internet search segment is highly concentrated, with Google, Yahoo! and Microsoft capturing over 90% of search queries. Total advertising spending on TV and newspapers declined from $105.6 billion in 2005 to $88.2 billion in 2009, but online advertising spending increased from $10 billion in 2005 to $24 billion in 2009. As of 2009, mobile advertising spending totalled $416 million, which is less than 2% of total online advertising spending. However, mobile advertising spending is projected to grow at an annual rate of 28% over the period of 2009 to 2013. The key segments of mobile ad spending are: (i) text messaging; (ii) search advertising; and (iii) display advertising. It is expected that mobile search advertising will comprise significantly more than 50% of all mobile advertising spending in the next three to five years. Search is at the heart of what Google does. It devotes more engineert to its search service than to any other product. By providing an unmatched search service, Google is the top Internet site in terms of traffic, reaching 40% of global Internet users every day, for an estimated 1.8 billion people in 2009. This means that on any given day, Google has an audience of approximately 720 million people. Google generates revenue primarily through advertising. Advertisers see Google as a channel to reach customers in a measurable, cost-effective and highly relevant way. They bid in an open and competitive auction to have their ads appear alongside the search results for particular keywords. Ads are useful to the people who see them as well as to the advertisers who run them. Advertisers utilize two key programs, Google AdWords, and Google AdSense, to promote their products and services on the web. In the AdWords program, advertisers bid in an open and competitive auction to have their ads appear alongside the search results for particular keywords. Google distinguishes ads from search results or other content on a page by labelling them as sponsored links or Ads by Google. The AdSense program delivers ads to Google partner/affiliate websites from its AdWords advertisers that are relevant to the content or search results partner sites; these partners include bloggers as well as major online publishers. The AdSense program enables advertisers to extend the reach of their ad campaigns, improves partners ability to generate revenue from their content and delivers relevant ads for their users. For several years, this effective monetization of search has enabled Google to become one of the fastest-growing and most profitable companies in the world. Advertising revenues grew at 121%, 95% and 73% in 2004, 2005 and 2006, respectively (Exhibit 1). Operating margins were 20%, 33% and for the same years, while market capitalization over the same period was http://www.alexa.com/siteinfo/google.com. 2 http://www.internetworldstats.com/stats.htm. ⒸHEC Montréal 51 $51.4 billion, $123 billion and $142.3 billion, respectively. But it was its operating cash flows that enabled Google to enter other markets and expand its advertising network. In 2004, 2005 and 2006, cash flows from operations were $977 million, $2.459 billion and $3.58 billion, respectively (Exhibit 2). Google expanded its online advertising network into web-based email (Gmail) and on-line video (YouTube) and partnered with independent web content developers through its AdSense program. Exhibit 1. Google Inc. s Historical Revenue Growth Google s Revenue (in thousands, except per share amounts) 2001 2002 Revenues YIY Growth Rate Google web sites YIY Growth Rate Google Network web sites YIY Growth Rate Total Advertising Revenues YIY Growth Rate Licensing & other revenues YIY Growth Rate As % of Revenues Google web sites Google Network web sites Licensing & other revenues Google Inc. s Acquisition of AdMob Source: http://investor.google.com/fin_data.html ⒸHEC Montréal 86,426 352% 66,932 NA 2007 439.508 1.465,934 3.189.223 6,138.560 10.604,917 16,593,986 21,795,550 23.650,563 409% 234% 118% 92% 7396 56% 31% 946 306,978 792.063 1.589,032 3,377.061 6.332,797 10,624,705 14.413.826 15,722,486 359% 158% 101% 113% 88% 68% 36% 9% 0 103,937 628,600 1,554,256 2.687.942 4,159.831 5,787.938 6.714.688 7.166,318 NA NA 505% 147% 73% 55% 39% 15% 79 66,932 310,915 1,420,663 3,143,288 6,065,003 10,492,628 16,412,643 21.128,514 NA 93% 73% 29% 73,558 112,289 181.343 667,036 60% 53% 61% 268% 56% 19,494 ΝΑ 514% 246% 121% 28,593 45,271 45,935 47% 58% 196 77% 096 2396 70% 24% 6% 2003 52 54% 43% 396 2004 50% 49% 196 2005 55% 44% 196 2006 60% 3996 196 2008 60% 35% 1% 666 31% 3% 2009 22,888,804 8% 761,759 1496 67% 30% 3% 53 Currency Consolidated Net Income Adjustments from Inc to Cash Change in Working Capital Other Operating Cash Flows Cash Flow from Operations Purchase of Pty Plant & Equip Purchase of Investments Disposal of Investments Other Investing Cash Flows Cash Flow from Investing. Change in LT Debt Change in Equity Other Financing Cash Flows Cash Flow from Financing Effect of Exchange Rate Change in Cash Opening Cash Closing Cash Depn & Amorth (CF) Net Purch of Pty Plant & Equip ⒸHEC Montréal Exhibit 2. Google Inc. s Historical Cash Flow Statements 12/31/2006 12/31/2005 12/31/2004 12/31/2003 12/31/2002 12/31/2001 12/31/2009 12/31/2008 12/31/2007 USD (in thousands) USD (in thousands) USD (in thousands) USD (in thousands) USD (in thousands) USD (in thousands) USD (in thousands) USD (in thousands USD in thousands) Yes Yes Yes Yes Yes Yes Yes Yes Yes 6,520,448 2.309,763 268,511 217,476 9,316,198 -809,888 -29,204,150 22,102.867 -108.024 -8,019,205 0 233,412 0 233,412 10,511 1,540,916 8,656,672 10,197,588 1,524,308 -809,888 4.226,858 3.298.767 -298,795 626.027 7,852,857 -2.358,461 -15.403,458 15,762,796 -3,320,299 -5,319,422 0 87,567 D 87,567 -45,923 2,575,079 6,081,593 8,656,672 Google Inc. s Acquisition of AdMob 1.499,887 -2.358,461 4,203,720 1,253,145 -426,257 744,802 5,775,410 -2,402,840 -16,031,571 15.659,473 -906,651 -3,681,589 0 403,067 0 403,067 40,034 2,536,922 3,544,671 6,081,593 967,658 -2,402,840 3,077,446 460,781 -356,133 398,414 3,580,508 -1,902,798 -27.701.038 23,107,132 -402,446 -6,899,150 0 2,966,398 2,966,398 19,741 332,503 3,877,174 3,544,671 5 0 571,939 -1.902,798 1,465,397 950,285 -43,660 87,400 2,459,422 -838,217 -12,675,880 10,257,214 -101,310 -3,358,193 -1,425 4,372,255 0 4,370,830 -21,758 3,450,301 426,873 3,877,174 293,812 -838,217 399,119 831.132 -127,980 -125,227 977,044 -318.995 -4.134,576 2,611,078 -58,863 -1,901,356 4,707 1.195,025 4,300 1.194.618 7,572 277,878 148,995 426,873 148,473 -318,995 105,648 296.028 88 -6,319 395,445 -176,801 -316.599 219,404 -39,958 -313.954 -7.386 15.476 0 8,090 1,662 91.243 57,752 148,995 55,049 -176.801 99.656 50.618 -6.526 11.517 155,265 37,198 -93,061 20,443 99 -109.717 -7,735 2.262 0 -5,473 0 40.075 17,677 57,752 28.983 -37.198 6,985 26,565 -4,859 2,398 31,089 -13,060 -26,389 11.460 -1,102 -29,091 4,503 2,030 34 -2,439 0 441 18,118 17,677 14,182 -13,060 p. 53 Google Inc. s Acquisition of AdMob Advertising revenues constituted 97% of Google s 2009 total revenues. Whereas the average growth of advertising revenues at Google was 243% over the period of 2002 to 2005, it averaged 41% over the period of 2006 to 2009 (Exhibit 3 and Exhibit 4). In 2009, Google s revenue growth from selling text advertisements linked to search queries slowed dramatically. In 2009, during one of the most severe economic recessions since the Great Depression, Google s year- over-year revenue growth diminished significantly to a mere 9% (Exhibit 1). Although the majority of the reduction in revenue growth could be attributed to the economic downturn, this reduction made Google realize that it was too dependent on revenue from on-line search advertising, which in turn now had a greater dependence on fixed Internet subscriber growth. By contrast, the rapid growth of mobile Internet advertising could make mobile advertising an important segment of the online advertising market. In order to bring in new growth and maintain its leadership in the online advertising market, the company needed to respond to the rapidly changing environment of the web. It had focused its efforts in two areas in particular: online display advertising (i.e., placing banner ads on the websites of content providers), a business where it lagged behind rivals like Yahoo!, and mobile advertising. In the mobile advertising business, Google was already ahead of its rivals, Microsoft and Yahoo!, in search advertising, a type of text advertising. Nevertheless, given the increasing penetration of smartphones with large screen displays and increasing availability of smartphone software applications, Google set its sights on another segment of the mobile advertising arena: mobile display advertising (i.e., mini-banners embedded in mobile websites and in mobile applications or apps ). ⒸHEC Montréal 54 5 Currency Consolidated Scale Total Revenue Direct Costs Gross Profit Selling General & Admin Research & Development Other Operating Expense Total Indirect Operating Costs Operating Income Interest Income Gains on Sale of Assets Foreign Exchange Gains Other Non-Operating Income Total Non-Operating Income Earnings Before Tax Taxation Extraordinary Items Accounting Changes Net Income Net Income to Common Shares Outstanding ⒸHEC Montréal 12/31/2009 0 USD USD Yes Yes Thousands Thousands Thousands 23,650,563 21,795,550 8,844,115 8,621,506 14,806,448 13,174,044 3,651,235 2,843,027 3,748,883 2,793,192 6,494,262 8,312,186 229,673 96,738 -259,778 Exhibit 3. Google Inc. s Historical Income Statements 12/31/2008 12/31/2007 0 0 6,520,448 0 6,542,075 6,631.969 389,533 94,205 -171,877 -1,090,234 -778,373 2,370 69,003 8,381,189 5,853.596 1,860,741 1,626,738 0 Google Inc. s Acquisition of AdMob 0 4,226,858 USD Yes 16,593,986 6,649,085 9,944,901 2,740,516 2,119,985 0 4,860,501 5,084,400 558,002 0 0 31,578 589,580 5,673,980 1,470,260 0 0 4,203,720 12/31/2006 12/31/2005 12/31/2004 USD USD Yes Yes Thousands Thousands 10,604,917 4,225,027 6,379,890 1.601,305 1,228,589 0 2,829,894 3.549,996 411,806 0 0 49,238 461,044 4,011,040 933,594 0 0 3,077,446 7 6,138,560 2,571,509 3,567,051 975,795 483,978 90,000 1,549,773 2,017,278 120,262 0 0 4,137 124,399 2,141,677 676,280 0 0 1,465,397 USD Yes Thousands 3,189,223 1,457,653 1,731,570 664,746 225,632 201,000 1,091,378 640,192 15,134 0 0 -5,092 10,042 650,234 251,115 0 0 399,119 12/31/2003 12/31/2002 USD USD Yes Yes Thousands Thousands 1,465,934 625,854 840,080 406,388 91.228 0 497,616 342,464 732 0 0 3,458 4,190 346,654 241,006 0 0 105,648 6.520,448 3,077,446 399,119 105,648 4,226,858 4,203,720 1,465,397 317,772,051 315.140.484 312,917,000 308,997,486 296,330,644 266,917,000 160,866,000 439,508 131,510 307,998 89,784 31,748 0 121,532 186,466 -1,355 0 0 -196 -1,551 184,915 85,259 0 0 99,656 99,656 145,346,000 12/31/2001 USD Yes Thousands 86,426 14,228 72,198 44,734 16,500 0 61,234 10,964 -897 0 0 1 -896 10,068 3.083 0 0 6,985 6,985 137,384,000 p. 55 Currency Consolidated Cash & Equivalents Short Term Investments Cash & Equivs & ST Investments Receivables (ST) Current Tax Assets Other Current Assets Total Current Assets Gross Property Plant & Equip Accumulated Depreciation Net Property Plant & Equip Long Term Investments Sawang Intangible Assets Deferred LT Assets Other Assets Total Assets Accounts Payable & Accrued Exps Accounts Payable Accrued Expenses Current Debt P Current Lease Obligations Other Current Liabilities Total Current Liabilities LT Debt & Leases Deferred LT Liabilities Other Liabilities www Total Liabilities Common Share Capital perce Preferred Share Capital wwwww Additional Paid-in Capital Retained Earnings Accum Other Comprehensive Income Other Equity Total Equity Total Liabilities & Equity ⒸHEC Montréal Google Inc. s Acquisition of AdMob Exhibit 4. Google Inc. s Historical Balance Sheets 12/31/2007 12/31/2006 12/31/2005 12/31/2004 12/31/2003 12/31/2002 12/31/2009 12/31/2008 USD (in thousands) USD (in thousands) USD (in thousands) USD (in thousands USD (in thousands USD (in thousands USD (in thousands) USD (in thousands) Yes Yes Yes Yes Yes Yes Yes Yes 10.197,588 14,287,187 24,484,775 3.178,471 667,650 836,062 29,166,958 8,130,134 3,285,524 4,844.610 128,977 goingentes 5,677,503 www.mand 262,611 www. 416,119 40,496,778 1,892,307 215,867 1,676,440 0 0 855,160 2,747,467 0 41.618 1,703,469 4,492,554 318 0 15,816,738 20,082,078 105,090 -83,348 36,004,224 40,496,778 8,656,672 7,189,099 15,845,771 2,642,192 286,105 1,404,114 20,178,182 7,576,341 2,342,498 5,233,843 85,160 5,836,544 0 433,846 31,767,575 1,522,194 178,004 1,344,190 0 7 0 779,896 2,302,090 Ny 0 42,333 1,184,290 3,528,713 315 0 220 14,450,338 13.561,630 226,579 -6,677 28,238,862 31,767,575 6,081.593 8,137,020 14,218,613 2,162.521 213,791 694,213 094,213 17,289,138 5,519.912 1,480,651 4,039,261 wwww..com 1,059,694 пр 2,745.964 4.140,304 33,219 PERS 168,530 25,335,806 1,392,497 282,106 1,110,391 0- 0 643,105 2,035,602 0 30.249 580.276 2,646,127 313 0 221 13,241,221 9,334,772 113,373 8 0 22,689,679 25,335,806 3,544,671 7,699,243 11,243,914 1,322,340 29,713 443,880 13.039.847 3,289,594 894,355 2,395,239 1,031,850 1,891,960 0 114,455 18,473,351 933,204 211,169 722,035 0 371,383 1,304,587 0 60,427 68,497 1,433,511 309 0 11,882,906 5,133,314 23,311 0 17,039,840 18,473,351 3,877,174 4,157,073 8,034,247 687,976 49,341 229,507 229,507 9,001,071 1,417,425 455,676 961,749 0 277,683 0 31,310 10,271,813 530,134 115,575 414,559 0 0 215,250 745,384 0 45,887 61,585 852,856 293 0 7,477,792 2,055,868 4,019 -119,015 9,418,957 10,271,813 426,873 1,705,424 2,132,297 311,836 89,972 159,360 2,693,465 583,068 204,152 378,916 0 wek 193,887 11,590 35,493 3,313,351 237,847 32,672 205,175 0 1,902 100,619 340,368 0 7,443 36,484 384,295 267 0 DEN 2,582,352 590,471 5,436 -249,470 2,929,056 3,313,351 148,995 185,723 334,718 154,690 22,105 40,721 560,234 261,837 73,582 188,255 0 105,556 0 17,413 871,458 168,369 46,175 122,194 0 4,621 62,462 235,452 1,988 23,524 21,724 282,688 P. 56 161 44,346 725,219 191,352 1,660 -373,968 588,770 871,458 57,752 88,579 146,331 61.994 12.646 10,825 231,796 86,886 33,013 53,873 0 96 29 0 1,127 286,892 37,022 9,394 27,628 0 - 4,350 48,136 89,508 6,512 2,481 14,438 112,939 145 44.346 83,410 85,704 49 -39,701 173,953 286,892 Mobile Internet Mobile phone activations are increasing more rapidly than purchases of any other consumer product. It has been frequently stated that half the world now has a mobile phone. Mobile Internet data connections are following this growth at a slower rate. Nevertheless, mobile Internet adoption has outpaced desktop Internet adoption. The number of iPhone and iPod Touch users nine quarters after they were launched was 57 million (Exhibit 5). The number of AOL subscribers (desktop Internet) nine quarters after it was launched was 7 million. More users will likely connect to the Internet via mobile devices rather than desktop PCs within the next five years. According to the Wall Street Journal (October 5, 2010; p. c12), smartphone sales are expanding at triple the rate of the PC market comprising desktops, laptops and notebooks. Gartner estimates global smartphone sales in 2010 will rise 56% to 268.8 million units, while PC shipments will increase 18% to 363.6 million units. For 2011, Gartner forecasts 431.7 million PCs will be shipped, compared with 413.6 million smartphones. And it projects 497 million PCs in 2012, below its forecast of 563.8 million smartphones. This is due primarily to five converging trends: 3G, social networking, video, voice over IP, and impressive mobile devices. Exhibit 5. Mobile Internet Ramping Mobile Internet Outpaces Desktop Internet Adoption iPhone + iTouch Users = 8x AOL Users 9 Quarters After Launch 1 Subscribers (MM) 60 50 ⒸHEC Montréal 40 30 20 10 Q1 Google Inc. s Acquisition of AdMob iPhone + iTouch vs. NTT docomo i-mode vs. AOL vs. Netscape Users First 20 Quarters Since Launch -57MM Mobile Internet iPhone+ (Touch Launched 6/07 Q3 Q5 Q7 -25MM ↓ -11MM -7MM Desktop Internet Netscape Launched 12/94 http://communities-dominate.blogs.com/brands/2007/01/putting 27 bill.html. Q9 Q11 Q13 Quarters Since Launch NTT docomo i-mode --iPhone + iTouch AOL-Netscape Netscape Morgan Stanley Note: ACL subscribers data not available before CQ394, Netscape users Amted to US only. Morgan Stanley Research estimates 23 -35MM netbooks have shipped in first eight quarters since launch (10/07). Source: Company Reports, Morgan Stanley Research 57 Q15 Q17 Mobile Internet NTT docomo i-mode Launched 6/99 Desktop Internet AOL v 2.0 Launched 9/94 ▬▬▬▬▬ Q19 3G. In very simple terms, 3G refers to the third generation of mobile wireless standards that enables a phone to use the most advanced and mature voice and data protocols. According to Morgan Stanley, penetration of 3G mobile technologies is forecasted to increase from 21 percent in 2010 to 43 percent in 2014. Google Inc. s Acquisition of AdMob Social networking. Web 2.0 applications enable consumers to easily and rapidly create online content and stay connected with their friends and family. Through social networking portals such as Facebook, Twitter and others, people can send messages, chat, post comments on their virtual walls, update their status, share videos, music, photos and stories, play games and make voice calls over the Internet. Consumers increasingly want to connect to these sites via the wireless mobile Internet. Video. Just like with desktop Internet, consumers will probably want to find, select, watch and share videos using the mobile Internet; Morgan Stanley estimates that global mobile data traffic will grow at a CAGR of 131% over 2008-2013. Voice over IP. Voice over Internet Protocol enables consumers to chat via voice, messaging and video; most VOIP communication currently occurs over the fixed Internet. With the mobile Internet, consumers will probably want to do the same while they re on the go. Impressive mobile devices. The iPod Touch and Apple s App Store have created the momentum for the mobile Internet, just as Windows 3.0 did for the PC in 1990 and Netscape did for the desktop Internet in 1995. The smartphone share of total handset shipments in 2009 is estimated at 25% in North America, 23% in Western Europe and 52% in Japan. According to a New York Times article by Claire Miller (April 24, 2011), The stakes were high. Mobile phones could be a huge new market for Google. Or they could provide an opening for a competitor to pounce, or obviate the need for a search engine altogether. If people on phones could go straight to apps for information, why Google anything? What are the implications of the significant growth of the mobile Internet for Google? Does this growth imply a significant growth opportunity in mobile Internet advertising? The mobile advertising market Mobile advertising spending The mobile advertising market enables brands, agencies and marketers to reach consumers directly on their mobile phones. Mobile phones are personal devices, which make them a very precise targeting communication tool. Mobile advertising can be used as a stand-alone medium or in cross-media (i.e., TV, print, radio, outdoor, cinema, online and direct mail) campaign plans. When compared with other types of advertising, the mobile advertising market is quite small, with $416 million in 2009 spending. In 2009, online advertising spending was $24 billion, newspaper advertising spending was $38 billion and TV advertising spending was $51 billion (Exhibit 6). Nevertheless, the mobile advertising market is expected to grow at an annual compounded rate of 28% from 2009 to 2013 (Exhibit 7); online advertising grew at an annual rate of 24% over the period 2005-2009. ⒸHEC Montréal 58 2008 $320 Exhibit 6. Advertising Spending in 2005 vs. 2009 (millions) Newspaper Online TV ⒸHEC Montréal $55 400 Google Inc. s Acquisition of AdMob $51 000 $50 200 Source: http://www.emarketer.com/Reports/All/Emarketer_2000591.aspx 2009 $38 000 $416 2010 $24 000 Exhibit 7. U.S. Mobile Advertising Spending, 2008-2013 (millions) $593 $10 000 59 2011 Source: http://www.emarketer.com/Reports/All/Emarketer_2000591.aspx $830 Mobile S- 2012 $416 $1 140 2005 2009 2013 $1560 Mobile advertising channels Multiple channels exist within mobile advertising: mobile websites, mobile applications, mobile messaging, and mobile videos (Exhibit 8). In terms of availability, on one end of the spectrum, there is the mobile messaging channel, which can be used to reach all mobile phone users regardless of whether they have a data service plan or mobile web access capabilities. At the other end there is the mobile video and TV channel, which requires that users have sophisticated video and mobile TV-enabled phones as well as premium-priced service plans. In between sit the mobile web channel and the mobile applications channel. Channel Mobile Web Mobile Applications Mobile Messaging Mobile Video and TV Google Inc. s Acquisition of AdMob ⒸHEC Montréal Exhibit 8. Mobile Advertising Channels Description The mobile web is a channel for delivery of web content, which offers and formats content to users in awareness of the mobile context. The mobile context is characterized by the nature of personal user information needs (e.g, updating your blog, accessing travel information, receiving news updates), constraints of mobile phones (i.e., screen size, keypad input) and special capabilities (i.e., location, connection type such as 3G or WLAN). Software or content that consumers download to or find pre-installed on their mobile phone and then resides on the phone. Examples include applications such as games, newsreaders and lifestyle tools. Downloads are accessible only to consumers with the appropriate mobile phones and data plans. This category includes SMS and Multimedia. Messaging Service (MMS). SMS is available to virtually all mobile phone users and does not typically require a data plan or mobile web access, making it ideal for reaching most mobile users. While SMS is limited to containing text, MMS can contain images, audio and even video content. Video and TV delivered over a mobile network to the mobile phone s media player. Videos may be downloaded or streamed and are usually accessed from a mobile web site or contained in an MMS message. Mobile video is accessible to consumers with mobile web and mobile video- enabled mobile phones and data plans. Mobile TV is accessible through mobile TV-enabled phones. Advertising Opportunities Banner ads on mobile websites Text ads on mobile 60 Websites Branded mobile web sites Good for: Driving users to a mobile website Lead generation Direct sales Branding Ad placement within applications (eg, banners, splash pages) Branded applications Good for: Branding/CRM Driving users to a mobile web site Text ads (SMS, MMS) Branding/CRM (SMS, MMS) Banner ads, splash pages (MMS) Animated images (MMS) Good for: Driving users to a mobile website Click to call Branding/CRM Interactive dialogue (eg, voting, polling) Video ads in pre-roll, mid-roll or post roll Static images, animation or video Clickable overlays Branded videos Driving users to a mobile web site Click to call Click to buy Source: Mobile Marketing Association. Mobile Advertising Overview, January 2009. Good for: Branding/CRM Within the mobile web channel, there are opportunities to provide ad inventory through banner ads on mobile websites, text ads on mobile websites and branded mobile websites. Google. currently dominates the market of text ads on mobile websites by following the same strategy as desktop Internet search advertising: listing text ads that are related to searches performed by users on Google s mobile website. The mobile applications (apps) channel provides ad inventory embedded in software or content that users download to or find pre-installed on their mobile phones. These can be games, newsreaders or lifestyle tools. Market share distribution - Mobile advertising spending In 2009, 55% of mobile advertising spending went to mobile messaging, particularly text messaging, 25% went to mobile websites and mobile applications, and the remaining 20% went to mobile search advertising. 4INFO, Cellfire, HipCricket, ILoopMobile and Verisign Messaging are the major players in text messaging. Google, Yahoo! and Bing dominate search engines, while AdMob, Jumptap, Mojiva, Quattro Wireless and AOL are considered leading mobile advertising networks (Exhibit 9) that serve both mobile websites and mobile applications websites. Select Players: Google Yahoo! Bing Google Inc. s Acquisition of AdMob Exhibit 9. Mobile Advertising Spending for 2009 (estimated) Mobile Advertising Spending, 2009 (est.) Select Players: AdMob Jumptap Mojiva Quattro Wireless AOL/Third Screen Media ⒸHEC Montréal Search 20% Apps & Websites 25% Text Messaging 55% Select Players: 4INFO Cellfire 61 HipCricket iLoopMobile Verisign Messaging Source: http://www.emarketer.com/Reports/All/Emarketer_2000591.aspx Although the mobile applications segment currently accounts for less than 25% of all mobile advertising spending, it is the segment with the greatest growth potential. There are two important factors driving the growth of this channel: first, there is an increased preference for unlimited data plans by customers. Subscribers with unlimited data plans increased from 16% to Source: eMarketer, 9/2009 21% from December 2008 to December 2009. Second, and most important, there is an increasing popularity of smartphones, phones equipped with powerful processors and large displays (e.g., Apple s iPhone, RIM s BlackBerry, and Google s NexusOne). Gartner forecasts that smartphone sales will surpass those of personal computers by 2012. So how large is the growth potential of the mobile applications advertising channel? Chetan Sharma Consulting estimates that mobile application downloads should jump from 7 billion in 2009 to almost 50 billion in 2012. During VentureBeat s MobileBeat 2009 conference, experts predicted that, With 10 million apps, the mobile applications market will be as big as the Internet in 2020. The panel also suggested that by the end of 2009, the market would grow to 100,000 apps. Exhibit 10. 2009 Market Share for Mobile Ad Networks. Total: 279MM. Sériel; Google; $28.00; 10% Série1; Others; $65.93; 24% Google Inc. s Acquisition of AdMob Série1; AOL;- $7.00; 3% Sériel: JumpTap; $11.00; 4% Sériel; Quattro Wireless; $21.00; 8% ⒸHEC Montréal ■ Série1; Microsoft; $23.00; 8% Source: http://www.mediapost.com/publications/?art_aid=117926&fa=Articles.show Article Série1; Yahoo; $32.00; 11% Série1; Millenia Media; $51.00; 18% Série1; Admob; $40.00; 14% Signs of this potential growth are beginning to show. According to Apple, its App Store hit 1.5 billion downloads. AdMob estimated Apple s monthly revenue from app downloads at $200 million or $2.4 billion per year. But AdMob s most important finding is the usage behaviour of users: They are happy spending money on apps for their smartphones, especially after they ve had a chance to try them for free. So who pays for all these free trials? Advertisers. And who links advertisers with app developers? Mobile advertising networks. http://www.mediabuyerplanner.com/entry/49025/mobile-users-increasingly-choose-unlimited-data-plans/. 2 http://mashable.com/2010/03/17/mobile-app-market-17-5-billion/. 3 http://www.businessinsider.com/apps-market-to-be-as-big-as-the-internet-in-2020-with-10-million-apps-2009-7. *http://gigaom.com/2009/08/27/how-big-is-apple-iphone-app-economy-the-answer-might-surprise-you/. 62 Mobile advertising networks Operators and publishers that own mobile websites can sell ads directly or through a third party. as premium inventory or as part of a mobile advertising (ad) network (Exhibit 10). Traditionally, an ad network connected websites that wanted to host advertisements with advertisers who wanted to run advertisements. Recently, ad networks have also been paying software developers for allowing their ads to be shown when people use their software applications. Mobile ad networks can be grouped into three classes: blind networks, premium blind networks and premium networks. This classification takes into account five characteristics: size (in terms of publishers, advertisers or impressions), publishers used to serve ads (independent publishers, independent and premium publishers and prestige publishers only), targeting options (from limited options to plenty of options), capability of advertisers to choose websites (no capability, capability at a premium, and capability), performance advertising options (cost-per-click, cost- per-action, and none), and brand advertising capabilities (limited cost-per-mille, some proportion of cost-per-mille, and predominantly cost-per-mille). Exhibit 11 provides details on the different types of ad networks and identifies the key players in each type of ad network. Exhibit 11. Business Model-Based Classification of Mobile Ad Networks Blind networks Premium networks Premium blind networks Medium-sized Google Inc. s Acquisition of AdMob Size in terms of publishers, advertisers and impressions. Primarily sereves ads through Targeting Options Allows advertisers to choose websites Performance Advertising ⒸHEC Montréal Brand advertising Key Players Largest Independent mobile publishers (sites and applications) By Country & by content channel (news, sports, etc.) Not usually Cost-Per-Click (CPC) is the norm Some, Cost-per- Mille (CPM) ¹ http://en.wikipedia.org/wiki/Advertising_network 2 Source: http://mobithinking.com/mobile-ad-network-guide Higher proportion of premium publishers (i.e. big-traffic mobile sites of well known brands: newspapers, broadcasters or operator portals) Admoda/Adultmoda; Millenial Media; Admob; BuzzCity: Jumptap; Madhouse: InMobi Quattro Wireless Lots At a premium price Some CPC, and some CPA (Cost-per- Action/Acquisition) Higher proportion 63 Smallest Prestiege publishers (mobile operators and big-name destinations). Lots Yes Rarely Every time a consumer clicks on an advertisement, the network charges the advertiser a certain amount; 35 cents, for example. 3 Goes beyond a click and into a specific action once the consumer lands on the advertiser s page. An action could be to fill out a form or purchase a product. Predominant (may be only) Microsoft Mobile Advertising: YOC Group: Advertising.com/AOL: Nokia Interactive Advertising: Pudding Media * A cost-per-mille payment is made for every 1,000 impressions. An impression is registered every time a web page from a content provider pulls the ad from the ad servers and is displayed on the content provider s web page. AdMob Google Inc. s Acquisition of AdMob Omar Hamoui, a visionary entrepreneur, founded AdMob in 2006 in order to remove roadblocks and enable mobile web businesses. AdMob s mission was: To provide the business models, services, tools, and data fundamental to the development and growth of the mobile Internet. AdMob delivered successful advertising results to businesses, regardless of their size or budget, by providing measurable, high return on investing solutions. AdMob s advertising client base (Ford, Coca-Cola, EA, P&G, Land Rover, MTV Europe, Adidas, and Paramount Pictures), mobile web publishers (AccuWeather, BluePulse, CBS Mobile, EA, Flirtomatic, Holliwood.com, Peperonity, and TinyTube) and winning accolades list (Mobile Marketing Association, Ad Age, Business Week, Wired Magazine and the World Economic Forum) reflect its successful business execution capabilities. AdMob developed three top initiatives to help businesses leverage the mobile Internet: Business Models: Through its mobile advertising network (Exhibit 12), AdMob served billions of targeted and personalized ads on the mobile web. This had two main beneficiaries: publishers that monetized their mobile web traffic, and advertisers that targeted and reached customers directly on their mobile devices. Services and Tools: Using AdMob Mobile Analytics (Exhibit 13), mobile website owners could get insight into their traffic and site usage, which in turn enabled them to make data-driven decisions about their mobile businesses. Data: Through its Mobile Metrics Report (Exhibit 14), AdMob shared information about the traffic in their network on an aggregate basis. This report was a snapshot of trends on the mobile Internet. As with most private companies, no public information on AdMob s financial performance was available. According to news reports,¹ by February 2009, AdMob had served 60 billion impressions worldwide since its launch in February 2006. Its display inventory generated 20% of its revenue and the rest came from text ads. Jason Spero, Vice President of Marketing for AdMob, stated in September 2008 that AdMob was charging advertisers 30 to 35 cents per click, or $25 to $30 cost per thousand impressions.² iPhone and Android were creating more mobile apps and more mobile web browsing, which in turn were creating more mobile ad inventory for AdMob to fill. Its gross revenue in November 2009 was approaching $100 million; AdMob s share of this revenue was estimated to be $60 million. ¹ Alex Farber, Answering the call, nma.co.uk, February, 2009. 2 Sarah Reedy, Advertisers Tap iPhone, Telephony, September 2008. ⒸHEC Montréal 64 Google Inc. s Acquisition of AdMob Exhibit 12. AdMob s Mobile Advertising Network Ad Network Advanced Targeting Meets Qualified Traffic AdMob provides innovative solutions for brand and performance advertisers, effective distribution for app developers and revenue opportunities for mobile site owners. Advertisers AdMob provides innovative solutions for brand and performance advertisers to engage your mobile target audience. Learn More Innovative ad formats to meet your unique needs ⒸHEC Montréal App Top Developers admob Connecting the Mobile Ecosystem AdMob provides app developers with a solution to distribute and monetize your apps. Learn More Drive downloads and grow your business Source: http://www.AdMob.com/marketplace Agencies AdMob offers turnkey solutions to help you get your brand in the hands of your target audience no matter where they are: at home, at work, at play, or in transit. Learn More 65 Reach your target audience on the mobile web Publishers Publishing ads on your site with AdMob allows you to monetize your mobile traffic with one of the fastest growing and highest performing networks of advertisers. Learn More Maximize your revenue opportunities C 600 Home Select Site TARTAP ed Real-time Dashboard - AdM x C http://analytics.admob.com/reports/ Apple Of Yahool Google Maps YouTube W Wikipedia AdMob Home Marketplace Analytics Metrics admob Dashboard Visitors Sources Site Usage > Events How often are the reports updated? Most reports for AdMob Mobile Anaytics are updated daily. However the dashboard report is updated periodically throughout the day The last cata point shows the current usage for each particular chart. Al dates and times are GMT Source: ⒸHEC Montréal TapTap-Real-time Dashboard Exhibit 13. AdMob Mobile Analytics Pageviews 174,545 LA Pageviews 12,000 A Google Inc. s Acquisition of AdMob 6,000 Top 5 Content URLs URL -1.43% stedetabuzzY //deals/crush or flush Top 5 Events Evere External Redirect THO Customize Feed Search Register Success http://analytics.admob.com/ /video/details/faceb /site/details/wapking Visits 56,363 A About AdMob Help Contact Terms of Service Privacy Policy Pageviews 5.542 5.340 2.792 2.761 2.360 Occurrences 31,186 5,434 240 189 -0.53% 66 News Dates: Last 30 Days Range: 2010-03-20-2010-04-18 of Total 6.47% 6.23% 3.20% 3.22% 2.75% More... Pageviews per Visit 3.11 www.-1.39% 0 - - Other Bookmarks analyticsdemo@admob.com/Log Out Top 5 Keywords Keywords % of Total 83.66% tap tap 14.56% cospace 0.64% forfree.com Sources by Pageviews Search Engines, 53.15% 0.51% mbuzzy.com 0.49% www.fortree.com More... Average Time Spent 00:02:31 Update Updated periodicaly throughout the day Zoomer: 76 m Pageviews 9,150 5.826 -14.00% 3,622 2,092 2,342 % of Total 10.90% 6.73% 4.34% 3.22% 2.80% More... © 2006-2009 AdMob, Inc Back to Main AdMob Mobile Metrics Our Insights on the Mobile Ecosystem February 2010 Mobile Metrics Report March 25th, 2010 Comments are closed In this month s report, we separate the traffic in our network into three categories-smartphones, feature phones and mobile Internet devices to examine the relative growth rates of each over the past year. Some of the highlights from the report include: Percentage of Traffic 60% 50% • Smartphones accounted for 48% of AdMob s worldwide traffic, up from 35% in February 2009, fueled by heavy application usage on iPhone and Android devices 40% Google Inc. s Acquisition of AdMob Although the share of feature phone traffic in AdMob s network declined from 58% to 35%, the absolute traffic from feature phones still grow 31%. This means that while the overall traffic from feature phones is growing, traffic from smartphones and mobile Intemet devices is growing faster. The mobile Intemet device category experienced the strongest growth of the three, increasing to account for 17% of traffic in AdMob s network in February 2010. Although the vast majority of traffic in this category comes from the Pod touch, the category also includes devices like the Sony PSP and Nintendo DSi Traffic Share by Handset Category, Worldwide AdMob Network 30% Exhibit 14. AdMob s Monthly Mobile Metrics Report 20% 10% 0% P ⒸHEC Montréal Newer Post Previous Post Download Report (PDF) Feb-09 Mar-09 Apr-09 May-09 Jun-09 Jul-09 Aug-09 Sep-09 Oct-09 Nov-09 Dec-09 Jan-10 Feb-10 -Mobile Internet Devices Smartphones -Feature Phones admob Based on a survey we ran last month, 11% of smartphone users are interested in purchasing an Pad. As more mobile Internet devices are introduced into the market, it will be interesting to see how traffic from the category grows relative to smartphones and feature phones. 67 We added trended data and a list of top smartphones to the country data sheets we cover each month. We also removed operator data from the monthly report, but will continue to share it on a regular basis. C Google Inc. s Acquisition of AdMob AdMob received $4 million in a Series A financing from angel investor Michael Dearing in September 2006. Subsequently, several venture capital firms invested in AdMob. It received $15 million in Series B funding from Accel Partners and Sequoia Capital in March 2007. It received $15.7 million in Series C funding from Sequoia Capital and Accel Partners in October 2008, and $12.5 million in Series C funding from Draper Fisher Jurvetson and Northgate Capital in January 2009. AdMob s total funding over the three-year period was $47.2 million. In recent years (according to Dow Jones VentureSource), the median percentage of a company sold in a first round was 40%, 33% in a second round, and 26% in a third or later round. These data can be assumed to apply for the AdMob financing rounds, since ownership stakes actually acquired by investors in AdMob in each funding round were not publicly available. Google s acquisition decision In 2005, DoubleClick was taken private by two private equity firms, Hellman and Friedman and JMI Equity, for $1.1 billion. At the time of the DoubleClick transaction, the mobile advertising market was in its infancy and expected to grow very rapidly. During 2007, several firms in the online advertising market were purchased at multiples between 10 and 15 times annual revenues. Google purchased DoubleClick for $3.1 billion, which was more than 10 times DoubleClick s revenue according to a New York Times article; Microsoft purchased aQuantive at a multiple of 13 times revenue, or about $6.3 billion, resulting in a 85% takeover premium over aQuantive s pre-acquisition stock price; and Yahoo! paid some $680 million for an 80% share of Right Media, which generated about $35 million in revenues in 2006. The acquisitions during this time reflect the intense rivalry between Google, Yahoo!, and Microsoft in seeking strong competitive positions in the online advertising market. Google has historically been an active acquirer, having completed over 100 acquisitions since 2000. While search-related Internet advertising via the personal computer continues to be a major driver of Google s growth, the emergence of the mobile Internet could provide significant opportunities for continuing growth. On May 21, 2010, the Federal Trade Commission (FTC) closed its investigation of Google s acquisition of AdMob, signalling that anti-trust concerns due to this acquisition were not warranted. The FTC stated, Google and AdMob today are the leading competitors among mobile ad networks, which drive the availability of free or low-cost applications and content for smartphones and other mobile devices. Mobile ad networks monetize mobile publishers content by selling publishers advertising space; advertising revenues, in turn, fuel the development of mobile applications and Internet content. Mobile application developers and other publishers rely on mobile ad networks to sell advertising space that they cannot effectively sell on their own. During the investigation, Apple acquired the third largest mobile ad network, Quattro Wireless, in December 2009 and then introduced its own mobile advertising network, iAd, as part of its iPhone applications package. The Commission has reason to believe that Apple quickly will become a strong mobile advertising network competitor. Apple not only has extensive relationships with application developers and users, but also is able to offer targeted ads (heretofore a strength of AdMob) by leveraging proprietary user data gleaned from users of Apple mobile devices. Furthermore, Apple s ownership of the iPhone software development tools, and its control over the developers license ⒸHEC Montréal 68 agreement, gives Apple the unique ability to define how competition among ad networks on the iPhone will occur and evolve. As a result of Apple s entry, AdMob s success to date on the iPhone platform is unlikely to be an accurate predictor of AdMob s competitive significance going forward, whether AdMob is owned by Google or not. This is particularly important given that AdMob s revenue and market share are derived largely from the iPhone platform. (FTC File No. 101-0031) Advertisers need help from firms such as AdMob and its competitors (Exhibit 15) to utilize technology to effectively deliver an ad to a mobile phone. Publishers/site owners often prefer to turn their supply of ad space over to intermediaries such as AdMob and its competitors who are more effective at placing ads. With its acquisition of AdMob for an estimated $750 million, Google is enhancing its presence in the mobile web and mobile advertising segments of the online advertising market. Exhibit 16 provides information on selected Google acquisitions, including offer prices and recent revenue or earnings for the acquired firms; Exhibit 17 provides data on Google s historical profitability drivers, and Exhibit 18 provides capital market data as of May 2010, at the time of the FTC s decision that allowed Google to complete its acquisition of AdMob. ⒸHEC Montréal SMS Ads to: 44636 Pizza Hen Google Inc. s Acquisition of AdMob Merton thead and g 5505place your order now Exhibit 15. Google vs. AdMob Advertising Types of Mobile Advertising Search Ads Web Display Ads App Display Ads 0 Bo Google s Focus Google 69 X- apdogod OO B AdMob s Focus admob 00 Proft Margin Gross Margin Price to earnings ratio Google Inc. s Turnover-control ratios Google Inc. s Profitability Ratios Return on assets Return on invested capital Asset tumover Fixed-Asset tumover Inventory turnover Collection period (in days) Days sales in cash Payables period (in days) Assets to equity Debt to assets Times interest earned Debt to assets (market value) Debt to equity (market value) Current ratio Acit test Acquisition Date Apr-03 Jan-06 ⒸHEC Montréal Oct-06 Mar-07 Apr-07 Jun-07 Jul-08 Aug-09 Nov-09 Feb-10 Mar-10 Google Inc. s levarage and liquidity ratios Exhibit 16. Selected Google Acquisitions of US Companies Acquired Firm Applied Semantics dMarc Broadcasting YouTube Adscape DoubleClick FeedBurner Omnisio On2 AdMob Aardvark DocVerse 12/31/2009 18% 1646 15% 28% 63% 30 12/31/2009 0.6 4.9 na 49.1 377.9 8.9 12/31/2009 1.12 0 na 0.02 0.02 10.62 10.62 Online Advertising Advertising Video Sharing In-game Advertising Online Advertising Web Feed Online Video Video Compression Online Advertising Social Search Microsoft Office File Sharing 12/31/2008 **** 1506 12/31/2008 Google Inc. s Acquisition of AdMob 12/31/2008 Exhibit 17. Google Inc. Historical Profitability Ratios 1.12 Acquired Firm Business 8.77 12/31/2007 1994 17% 15% 25% 50% 52 12/31/2007 0.7 4.1 na 47.6 312.8 15.5 12/31/2007 1.12 0 na 0.01 0.01 8.49 8.49 Offer Price $102 mill. $102 mill. $1.65 bill. $23 mill $3.1 bill $100 mill. $15 mill $124.6 mill. $750 mill. $50 mill $25 mill. 12/31/2006 18% 17% 14% 29% 60% 46 12/31/2006 22 0.6 4.4 na 45.5 387.0 18.2 12/31/2006 1.08 0 na Acquired Firm Revenues 0.01 0.01 10.00 10.00 NA NA $224 mill. ΝΑ $300 mill. ΝΑ ΝΑ $16.3 mill. $45 mill-$60 mill. NA NA 12/31/2005 16% 1496 14% 24% 58% 83 12/31/2005 0.6 6.4 na 40.9 477.7 16.4 12/31/2005 1.09 0 na 0.01 0.01 12.08 12.08 Acquired Firm Earnings NA NA NA NA $50 mill. ΝΑ NA Losses NA NA NA 12/31/2004 149% 12% 14% 13% 54% 132 12/31/2004 10 8.4 na 35.7 244.0 8.2 12/31/2004 1.13 0 na 0.01 0.01 7.91 7.91 12/31/2003 18% 1296 38% 746 5796 0 12/31/2003 17 7.8 na 38.5 83.3 26.9 12/31/2003 1,48 0.002281234 na 1.00 2.38 2.38 12/31/2002 57% 3596 67% 23% 70% 0 12/31/2002 1.5 8.2 na 51.5 121.5 26.1 12/31/2002 1.65 0.022698437 137.61 1.00 2.59 2.59 12/31/2001 ra na na 8% 84% 0 12/31/2001 na na na 0 0 0 12/31/2001 na na 12.22 na na na na 8 p. 70 71 Shares Outstanding Price per Share Equity Market Value of Equity (thousands) Book Value of Equity (thousands) Debt Market Value of Debt Book Value of Debt Risk Free Rate, 1-year Treasury Note: Average for May, 2010 Risk Free Rate, 10-year Treasury Note: Average for May, 2010 Required Market Risk Premium relative to 10-year Treasury Note Beta Google Inc. s Valuation ratios Price / Earnings MV Firm/EBIT (1-Tax rate) Price / Sales MV firm / Sales MV Equity / BV Equity MV firm/BV firm 2013-01-29 ⒸHEC Montréal 12/31/2009 317,772,051 619.98 0 0 $ 197,012.316.18 $ 96,952,969.90 $ 216,375,847.16 $142,287,162.35 $122,935,730.97 $ 51,458,928.43 36,004,224 28,238,862 22,689,679 17,039,840 9,418,957 2,929,056 0.35% 3.42% 5% -6% 1.12 Google Inc. s Acquisition of AdMob 12/31/2009 30.38 30.47 8.33 8.33 5.47 5,47 Exhibit 18. Google Inc. Capital Market Data 12/31/2008 12/31/2007 12/31/2006 12/31/2005 12/31/2004 12/31/2003 315,140,484 312,917,000 308,997,486 296,330,644 266,917,000 160,866,000 307.65 691.48 460.48 414.86 192.79 0 0 12/31/2008 23.11 20.25 4.45 4.45 3.43 3.43 0 0 12/31/2007 52.03 57,44 13.04 13.04 9.54 9.54 23 0 0 12/31/2006 46.33 52.24 13.42 13.42 8.35 8.35 0 0 12/31/2005 82.64 89.07 20.03 20.03 13.05 13.05 0 0 12/31/2004 132.05 130.95 16.14 16.14 17.57 17.57 12/31/2003 12/31/2002 145,346,000 12/31/2002 p. 71 Google Inc Risk Free Rate, 1-year Treasury Note: Average for May, 2010 Risk Free Rate, 10-year Treasury Note: Average for May, 2010 Required Market Risk Premium relative to 10-year Treasury Note Beta Google s estimated ke (based on case Exhibit 18) Adjustment for Size, Liquidity Admobs Cost of Equity Capital Admob s FCF Estimates (in millions) Net Revenues EBIT(1-T) Depreciation Capex Change in NWC Free Cash Flows AdMob s Terminal Value estimates Warranted MV firm / EBIT (1-tax rate), using Google s 2009 multiple Warranted MV firm / Sales, using Googles s 2009 multiple Value of AdMob Using, Warranted MV Firm / EBIT (1-tax rate); as multiple Using, Warranted MV Firm / Sales; as multiple 0.35% 3.42% 5% -6% 1.12 15% ? 31/12/2013 $146.48 $31.29 $10.10 $23.18 $137.24 ? 31/12/2013 31/12/2012 $107.04 $13.97 $7.31 $10.67 $28.45 ? 31/12/2012 31/12/2011 $77.93 $11.83 $5.32 $11.91 $7.56 ? 31/12/2011 31/12/2010 $55.68 $15.35 $2.57 $11.37 $11.34 ? 31/12/2010 31/12/2009 31/12/2009 ijcsm INTERNATIONAL JOURNAL OF CASE STUDIES IN MANAGEMENT Google Inc. s Acquisition of AdMob Case prepared by Professor Nikhil VARAIYA¹ Volume 11 Issue 1 April 2013 Introduction On Monday, November 9, 2009, Google Inc. announced that it would purchase mobile advertising start-up AdMob in a stock-and-cash financed acquisition valued at $750 million. AdMob, founded in 2006, sells ads across thousands of websites that are tailored for mobile phones. It was one of the first companies to offer ads that run inside software for the Apple iPhone and devices that run Google s Android operating system. Mobile (phone) advertising spending is expected to constitute an increasing share of total online advertising spending. Along with other start-ups, AdMob competes with established players such as Google, Yahoo!, Bing and major cell phone carriers such as Sprint, AT&T and Verizon Wireless to offer and profit from mobile advertising. JP Morgan estimated AdMob s 2009 revenues at between $45 and $60 million. This suggests that Google s offer price for AdMob is a generous multiple of 12 to 17 times AdMob s estimated 2009 revenue. In a sign of increased acquisition activity, on Monday, January 5, 2010, Apple Inc. announced that it had acquired Quattro Wireless, a competitor of AdMob, for $275 million. It was reported that Apple too had earlier tried to acquire AdMob. The Wall Street Journal reported on April 7, 2010, that the Federal Trade Commission (FTC) was reviewing an anti-trust challenge to Google s proposed acquisition. Broadpoint Amtech analyst Brian Marshall stated, Clearly Apple and Google continue to run down parallel paths... it s all about mobile advertising on smartphones, they are trying to maximize the dollars they create online (Reuters, January 5, 2010). After conducting an intensive review, the FTC announced on Friday, May 21, 2010, that it had closed its investigation of Google s proposed. acquisition of AdMob, thereby clearing the way for Google s acquisition offer. Google has grown through both organic expansion and acquisition. Per data from Thomson- Reuters SDC database, Google completed well over 100 acquisitions between 2000 and 2010, worth an estimated total of $8.6 billion. More than 50% of the acquisition dollars were spent on target firms in the online advertising market. Google CFO Patrick Pichette recently described acquisitions as an accelerator for growth. He reiterated, So for M&A the mindset is to comb ¹Nikhil Varaiya is a Professor in the Department of Finance at San Diego State University, USA. ⒸHEC Montréal 2013 All rights reserved for all countries. Any translation or alteration in any form whatsoever is prohibited. The International Journal of Case Studies in Management is published on-line (www.hec.ca/revuedecas/en), ISSN 1911-2599. This case is intended to be used as the framework for an educational discussion and does not imply any judgement on the administrative situation presented. Deposited under number 9 20 2013 001 with the HEC Montréal Case Centre, 3000, chemin de la Côte-Sainte-Catherine, Montréal (Québec) Canada H3T 2A7. 49 the world constantly, given our agenda of development. If we find a piece that fits what we are going to do in 8 to 12 months-for example, we have a team of 6 and we know we need a team of 15, then M&A is an accelerator because it fits into a very clear plan of what we are trying to achieve (McKinsey Quarterly, August 2011). While acquisitions have historically been an important driver of growth for the acquiring firms, they can also pose considerable risk. In the typical acquisition of a publicly traded target firm, target shareholders reap considerable financial gains since such acquisitions occur at significant premiums to the target s pre-acquisition stock price, with premiums averaging 30 to 40%. However, the record for acquiring firm shareholders is mixed; the share prices of acquirers exhibit marginal increases on average following acquisition announcements, and assessing the long-run impacts of acquisitions is difficult as the time period following acquisition becomes longer. It has also been reported that more than half of all acquisitions fail to create value for the acquiring firms due primarily to post-merger integration failures. However, an issue is whether active acquirers such as Google are more likely to be successful at post-merger integration, thereby increasing significantly the likelihood of undertaking value-creating acquisitions. In its evaluation of young technology firms such as Google, the investment community places significant weight on the expected future growth rates of revenues and earnings of such firms. Such firms have historically exhibited high growth rates in terms of revenues, earnings and market capitalizations. Hence, the managements of these firms are very cognizant of the valuation implications of any divergences between their own internal growth forecasts and growth expectations of the external investment community. This growth dynamic can create a constant search for growth opportunities by managements of these firms. The table below contains data on Google s market capitalization, earnings and book value of equity for the period 12/31/2004 - 6/30/2010 (annual data through 2009; first two quarters of 2010); Google s IPO occurred in 2004. Market Value of Equity (billions) Book Value of Equity (billions) Earnings. (billions) PE Ratio (S&P 500) 12/31/04 $51.46 ⒸHEC Montréal $2.90 Google Inc. s Acquisition of AdMob $0.40 20.4 12/31/05 $122.93 $9.40 $1.46 18.7 12/31/06 $142.29 $17.04 $3.10 17.3 12/31/07 50 $216.37 $22.69 $4.20 18.9 12/31/08 $96.95 $28.24 $4.23 28.2 12/31/09 $197.01 $36.00 $6.50 53.8 6/30/10 $141.80 $40.61 $3.85 Google Inc. Google is a global technology company whose mission is to organize the world s information and make it universally accessible and useful. It maintains a large index of websites and other online content and makes this content freely available through its search engine to anyone on the Internet. Google s search technology helps people obtain nearly instant access to relevant online information. 16.8 Google Inc. s Acquisition of AdMob The online advertising industry is engaged in buying and selling advertising space on web pages that are accessed by viewers on the Internet; the Internet itself is accessed via desktop or laptop computers, smartphones and other mobile devices. The industry is often divided into: (i) search advertising that appears on search-results pages; (ii) display advertising that appears on non- search web pages; (iii) classified listings that appear on websites; and (iv) email-based advertisements. As of 2009, the distribution of ad spending across these categories indicates that search advertising dominates with a 47% share, followed by display advertising at 22%. The Internet search segment is highly concentrated, with Google, Yahoo! and Microsoft capturing over 90% of search queries. Total advertising spending on TV and newspapers declined from $105.6 billion in 2005 to $88.2 billion in 2009, but online advertising spending increased from $10 billion in 2005 to $24 billion in 2009. As of 2009, mobile advertising spending totalled $416 million, which is less than 2% of total online advertising spending. However, mobile advertising spending is projected to grow at an annual rate of 28% over the period of 2009 to 2013. The key segments of mobile ad spending are: (i) text messaging; (ii) search advertising; and (iii) display advertising. It is expected that mobile search advertising will comprise significantly more than 50% of all mobile advertising spending in the next three to five years. Search is at the heart of what Google does. It devotes more engineert to its search service than to any other product. By providing an unmatched search service, Google is the top Internet site in terms of traffic, reaching 40% of global Internet users every day, for an estimated 1.8 billion people in 2009. This means that on any given day, Google has an audience of approximately 720 million people. Google generates revenue primarily through advertising. Advertisers see Google as a channel to reach customers in a measurable, cost-effective and highly relevant way. They bid in an open and competitive auction to have their ads appear alongside the search results for particular keywords. Ads are useful to the people who see them as well as to the advertisers who run them. Advertisers utilize two key programs, Google AdWords, and Google AdSense, to promote their products and services on the web. In the AdWords program, advertisers bid in an open and competitive auction to have their ads appear alongside the search results for particular keywords. Google distinguishes ads from search results or other content on a page by labelling them as sponsored links or Ads by Google. The AdSense program delivers ads to Google partner/affiliate websites from its AdWords advertisers that are relevant to the content or search results partner sites; these partners include bloggers as well as major online publishers. The AdSense program enables advertisers to extend the reach of their ad campaigns, improves partners ability to generate revenue from their content and delivers relevant ads for their users. For several years, this effective monetization of search has enabled Google to become one of the fastest-growing and most profitable companies in the world. Advertising revenues grew at 121%, 95% and 73% in 2004, 2005 and 2006, respectively (Exhibit 1). Operating margins were 20%, 33% and for the same years, while market capitalization over the same period was http://www.alexa.com/siteinfo/google.com. 2 http://www.internetworldstats.com/stats.htm. ⒸHEC Montréal 51 $51.4 billion, $123 billion and $142.3 billion, respectively. But it was its operating cash flows that enabled Google to enter other markets and expand its advertising network. In 2004, 2005 and 2006, cash flows from operations were $977 million, $2.459 billion and $3.58 billion, respectively (Exhibit 2). Google expanded its online advertising network into web-based email (Gmail) and on-line video (YouTube) and partnered with independent web content developers through its AdSense program. Exhibit 1. Google Inc. s Historical Revenue Growth Google s Revenue (in thousands, except per share amounts) 2001 2002 Revenues YIY Growth Rate Google web sites YIY Growth Rate Google Network web sites YIY Growth Rate Total Advertising Revenues YIY Growth Rate Licensing & other revenues YIY Growth Rate As % of Revenues Google web sites Google Network web sites Licensing & other revenues Google Inc. s Acquisition of AdMob Source: http://investor.google.com/fin_data.html ⒸHEC Montréal 86,426 352% 66,932 NA 2007 439.508 1.465,934 3.189.223 6,138.560 10.604,917 16,593,986 21,795,550 23.650,563 409% 234% 118% 92% 7396 56% 31% 946 306,978 792.063 1.589,032 3,377.061 6.332,797 10,624,705 14.413.826 15,722,486 359% 158% 101% 113% 88% 68% 36% 9% 0 103,937 628,600 1,554,256 2.687.942 4,159.831 5,787.938 6.714.688 7.166,318 NA NA 505% 147% 73% 55% 39% 15% 79 66,932 310,915 1,420,663 3,143,288 6,065,003 10,492,628 16,412,643 21.128,514 NA 93% 73% 29% 73,558 112,289 181.343 667,036 60% 53% 61% 268% 56% 19,494 ΝΑ 514% 246% 121% 28,593 45,271 45,935 47% 58% 196 77% 096 2396 70% 24% 6% 2003 52 54% 43% 396 2004 50% 49% 196 2005 55% 44% 196 2006 60% 3996 196 2008 60% 35% 1% 666 31% 3% 2009 22,888,804 8% 761,759 1496 67% 30% 3% 53 Currency Consolidated Net Income Adjustments from Inc to Cash Change in Working Capital Other Operating Cash Flows Cash Flow from Operations Purchase of Pty Plant & Equip Purchase of Investments Disposal of Investments Other Investing Cash Flows Cash Flow from Investing. Change in LT Debt Change in Equity Other Financing Cash Flows Cash Flow from Financing Effect of Exchange Rate Change in Cash Opening Cash Closing Cash Depn & Amorth (CF) Net Purch of Pty Plant & Equip ⒸHEC Montréal Exhibit 2. Google Inc. s Historical Cash Flow Statements 12/31/2006 12/31/2005 12/31/2004 12/31/2003 12/31/2002 12/31/2001 12/31/2009 12/31/2008 12/31/2007 USD (in thousands) USD (in thousands) USD (in thousands) USD (in thousands) USD (in thousands) USD (in thousands) USD (in thousands) USD (in thousands USD in thousands) Yes Yes Yes Yes Yes Yes Yes Yes Yes 6,520,448 2.309,763 268,511 217,476 9,316,198 -809,888 -29,204,150 22,102.867 -108.024 -8,019,205 0 233,412 0 233,412 10,511 1,540,916 8,656,672 10,197,588 1,524,308 -809,888 4.226,858 3.298.767 -298,795 626.027 7,852,857 -2.358,461 -15.403,458 15,762,796 -3,320,299 -5,319,422 0 87,567 D 87,567 -45,923 2,575,079 6,081,593 8,656,672 Google Inc. s Acquisition of AdMob 1.499,887 -2.358,461 4,203,720 1,253,145 -426,257 744,802 5,775,410 -2,402,840 -16,031,571 15.659,473 -906,651 -3,681,589 0 403,067 0 403,067 40,034 2,536,922 3,544,671 6,081,593 967,658 -2,402,840 3,077,446 460,781 -356,133 398,414 3,580,508 -1,902,798 -27.701.038 23,107,132 -402,446 -6,899,150 0 2,966,398 2,966,398 19,741 332,503 3,877,174 3,544,671 5 0 571,939 -1.902,798 1,465,397 950,285 -43,660 87,400 2,459,422 -838,217 -12,675,880 10,257,214 -101,310 -3,358,193 -1,425 4,372,255 0 4,370,830 -21,758 3,450,301 426,873 3,877,174 293,812 -838,217 399,119 831.132 -127,980 -125,227 977,044 -318.995 -4.134,576 2,611,078 -58,863 -1,901,356 4,707 1.195,025 4,300 1.194.618 7,572 277,878 148,995 426,873 148,473 -318,995 105,648 296.028 88 -6,319 395,445 -176,801 -316.599 219,404 -39,958 -313.954 -7.386 15.476 0 8,090 1,662 91.243 57,752 148,995 55,049 -176.801 99.656 50.618 -6.526 11.517 155,265 37,198 -93,061 20,443 99 -109.717 -7,735 2.262 0 -5,473 0 40.075 17,677 57,752 28.983 -37.198 6,985 26,565 -4,859 2,398 31,089 -13,060 -26,389 11.460 -1,102 -29,091 4,503 2,030 34 -2,439 0 441 18,118 17,677 14,182 -13,060 p. 53 Google Inc. s Acquisition of AdMob Advertising revenues constituted 97% of Google s 2009 total revenues. Whereas the average growth of advertising revenues at Google was 243% over the period of 2002 to 2005, it averaged 41% over the period of 2006 to 2009 (Exhibit 3 and Exhibit 4). In 2009, Google s revenue growth from selling text advertisements linked to search queries slowed dramatically. In 2009, during one of the most severe economic recessions since the Great Depression, Google s year- over-year revenue growth diminished significantly to a mere 9% (Exhibit 1). Although the majority of the reduction in revenue growth could be attributed to the economic downturn, this reduction made Google realize that it was too dependent on revenue from on-line search advertising, which in turn now had a greater dependence on fixed Internet subscriber growth. By contrast, the rapid growth of mobile Internet advertising could make mobile advertising an important segment of the online advertising market. In order to bring in new growth and maintain its leadership in the online advertising market, the company needed to respond to the rapidly changing environment of the web. It had focused its efforts in two areas in particular: online display advertising (i.e., placing banner ads on the websites of content providers), a business where it lagged behind rivals like Yahoo!, and mobile advertising. In the mobile advertising business, Google was already ahead of its rivals, Microsoft and Yahoo!, in search advertising, a type of text advertising. Nevertheless, given the increasing penetration of smartphones with large screen displays and increasing availability of smartphone software applications, Google set its sights on another segment of the mobile advertising arena: mobile display advertising (i.e., mini-banners embedded in mobile websites and in mobile applications or apps ). ⒸHEC Montréal 54 5 Currency Consolidated Scale Total Revenue Direct Costs Gross Profit Selling General & Admin Research & Development Other Operating Expense Total Indirect Operating Costs Operating Income Interest Income Gains on Sale of Assets Foreign Exchange Gains Other Non-Operating Income Total Non-Operating Income Earnings Before Tax Taxation Extraordinary Items Accounting Changes Net Income Net Income to Common Shares Outstanding ⒸHEC Montréal 12/31/2009 0 USD USD Yes Yes Thousands Thousands Thousands 23,650,563 21,795,550 8,844,115 8,621,506 14,806,448 13,174,044 3,651,235 2,843,027 3,748,883 2,793,192 6,494,262 8,312,186 229,673 96,738 -259,778 Exhibit 3. Google Inc. s Historical Income Statements 12/31/2008 12/31/2007 0 0 6,520,448 0 6,542,075 6,631.969 389,533 94,205 -171,877 -1,090,234 -778,373 2,370 69,003 8,381,189 5,853.596 1,860,741 1,626,738 0 Google Inc. s Acquisition of AdMob 0 4,226,858 USD Yes 16,593,986 6,649,085 9,944,901 2,740,516 2,119,985 0 4,860,501 5,084,400 558,002 0 0 31,578 589,580 5,673,980 1,470,260 0 0 4,203,720 12/31/2006 12/31/2005 12/31/2004 USD USD Yes Yes Thousands Thousands 10,604,917 4,225,027 6,379,890 1.601,305 1,228,589 0 2,829,894 3.549,996 411,806 0 0 49,238 461,044 4,011,040 933,594 0 0 3,077,446 7 6,138,560 2,571,509 3,567,051 975,795 483,978 90,000 1,549,773 2,017,278 120,262 0 0 4,137 124,399 2,141,677 676,280 0 0 1,465,397 USD Yes Thousands 3,189,223 1,457,653 1,731,570 664,746 225,632 201,000 1,091,378 640,192 15,134 0 0 -5,092 10,042 650,234 251,115 0 0 399,119 12/31/2003 12/31/2002 USD USD Yes Yes Thousands Thousands 1,465,934 625,854 840,080 406,388 91.228 0 497,616 342,464 732 0 0 3,458 4,190 346,654 241,006 0 0 105,648 6.520,448 3,077,446 399,119 105,648 4,226,858 4,203,720 1,465,397 317,772,051 315.140.484 312,917,000 308,997,486 296,330,644 266,917,000 160,866,000 439,508 131,510 307,998 89,784 31,748 0 121,532 186,466 -1,355 0 0 -196 -1,551 184,915 85,259 0 0 99,656 99,656 145,346,000 12/31/2001 USD Yes Thousands 86,426 14,228 72,198 44,734 16,500 0 61,234 10,964 -897 0 0 1 -896 10,068 3.083 0 0 6,985 6,985 137,384,000 p. 55 Currency Consolidated Cash & Equivalents Short Term Investments Cash & Equivs & ST Investments Receivables (ST) Current Tax Assets Other Current Assets Total Current Assets Gross Property Plant & Equip Accumulated Depreciation Net Property Plant & Equip Long Term Investments Sawang Intangible Assets Deferred LT Assets Other Assets Total Assets Accounts Payable & Accrued Exps Accounts Payable Accrued Expenses Current Debt P Current Lease Obligations Other Current Liabilities Total Current Liabilities LT Debt & Leases Deferred LT Liabilities Other Liabilities www Total Liabilities Common Share Capital perce Preferred Share Capital wwwww Additional Paid-in Capital Retained Earnings Accum Other Comprehensive Income Other Equity Total Equity Total Liabilities & Equity ⒸHEC Montréal Google Inc. s Acquisition of AdMob Exhibit 4. Google Inc. s Historical Balance Sheets 12/31/2007 12/31/2006 12/31/2005 12/31/2004 12/31/2003 12/31/2002 12/31/2009 12/31/2008 USD (in thousands) USD (in thousands) USD (in thousands) USD (in thousands USD (in thousands USD (in thousands USD (in thousands) USD (in thousands) Yes Yes Yes Yes Yes Yes Yes Yes 10.197,588 14,287,187 24,484,775 3.178,471 667,650 836,062 29,166,958 8,130,134 3,285,524 4,844.610 128,977 goingentes 5,677,503 www.mand 262,611 www. 416,119 40,496,778 1,892,307 215,867 1,676,440 0 0 855,160 2,747,467 0 41.618 1,703,469 4,492,554 318 0 15,816,738 20,082,078 105,090 -83,348 36,004,224 40,496,778 8,656,672 7,189,099 15,845,771 2,642,192 286,105 1,404,114 20,178,182 7,576,341 2,342,498 5,233,843 85,160 5,836,544 0 433,846 31,767,575 1,522,194 178,004 1,344,190 0 7 0 779,896 2,302,090 Ny 0 42,333 1,184,290 3,528,713 315 0 220 14,450,338 13.561,630 226,579 -6,677 28,238,862 31,767,575 6,081.593 8,137,020 14,218,613 2,162.521 213,791 694,213 094,213 17,289,138 5,519.912 1,480,651 4,039,261 wwww..com 1,059,694 пр 2,745.964 4.140,304 33,219 PERS 168,530 25,335,806 1,392,497 282,106 1,110,391 0- 0 643,105 2,035,602 0 30.249 580.276 2,646,127 313 0 221 13,241,221 9,334,772 113,373 8 0 22,689,679 25,335,806 3,544,671 7,699,243 11,243,914 1,322,340 29,713 443,880 13.039.847 3,289,594 894,355 2,395,239 1,031,850 1,891,960 0 114,455 18,473,351 933,204 211,169 722,035 0 371,383 1,304,587 0 60,427 68,497 1,433,511 309 0 11,882,906 5,133,314 23,311 0 17,039,840 18,473,351 3,877,174 4,157,073 8,034,247 687,976 49,341 229,507 229,507 9,001,071 1,417,425 455,676 961,749 0 277,683 0 31,310 10,271,813 530,134 115,575 414,559 0 0 215,250 745,384 0 45,887 61,585 852,856 293 0 7,477,792 2,055,868 4,019 -119,015 9,418,957 10,271,813 426,873 1,705,424 2,132,297 311,836 89,972 159,360 2,693,465 583,068 204,152 378,916 0 wek 193,887 11,590 35,493 3,313,351 237,847 32,672 205,175 0 1,902 100,619 340,368 0 7,443 36,484 384,295 267 0 DEN 2,582,352 590,471 5,436 -249,470 2,929,056 3,313,351 148,995 185,723 334,718 154,690 22,105 40,721 560,234 261,837 73,582 188,255 0 105,556 0 17,413 871,458 168,369 46,175 122,194 0 4,621 62,462 235,452 1,988 23,524 21,724 282,688 P. 56 161 44,346 725,219 191,352 1,660 -373,968 588,770 871,458 57,752 88,579 146,331 61.994 12.646 10,825 231,796 86,886 33,013 53,873 0 96 29 0 1,127 286,892 37,022 9,394 27,628 0 - 4,350 48,136 89,508 6,512 2,481 14,438 112,939 145 44.346 83,410 85,704 49 -39,701 173,953 286,892 Mobile Internet Mobile phone activations are increasing more rapidly than purchases of any other consumer product. It has been frequently stated that half the world now has a mobile phone. Mobile Internet data connections are following this growth at a slower rate. Nevertheless, mobile Internet adoption has outpaced desktop Internet adoption. The number of iPhone and iPod Touch users nine quarters after they were launched was 57 million (Exhibit 5). The number of AOL subscribers (desktop Internet) nine quarters after it was launched was 7 million. More users will likely connect to the Internet via mobile devices rather than desktop PCs within the next five years. According to the Wall Street Journal (October 5, 2010; p. c12), smartphone sales are expanding at triple the rate of the PC market comprising desktops, laptops and notebooks. Gartner estimates global smartphone sales in 2010 will rise 56% to 268.8 million units, while PC shipments will increase 18% to 363.6 million units. For 2011, Gartner forecasts 431.7 million PCs will be shipped, compared with 413.6 million smartphones. And it projects 497 million PCs in 2012, below its forecast of 563.8 million smartphones. This is due primarily to five converging trends: 3G, social networking, video, voice over IP, and impressive mobile devices. Exhibit 5. Mobile Internet Ramping Mobile Internet Outpaces Desktop Internet Adoption iPhone + iTouch Users = 8x AOL Users 9 Quarters After Launch 1 Subscribers (MM) 60 50 ⒸHEC Montréal 40 30 20 10 Q1 Google Inc. s Acquisition of AdMob iPhone + iTouch vs. NTT docomo i-mode vs. AOL vs. Netscape Users First 20 Quarters Since Launch -57MM Mobile Internet iPhone+ (Touch Launched 6/07 Q3 Q5 Q7 -25MM ↓ -11MM -7MM Desktop Internet Netscape Launched 12/94 http://communities-dominate.blogs.com/brands/2007/01/putting 27 bill.html. Q9 Q11 Q13 Quarters Since Launch NTT docomo i-mode --iPhone + iTouch AOL-Netscape Netscape Morgan Stanley Note: ACL subscribers data not available before CQ394, Netscape users Amted to US only. Morgan Stanley Research estimates 23 -35MM netbooks have shipped in first eight quarters since launch (10/07). Source: Company Reports, Morgan Stanley Research 57 Q15 Q17 Mobile Internet NTT docomo i-mode Launched 6/99 Desktop Internet AOL v 2.0 Launched 9/94 ▬▬▬▬▬ Q19 3G. In very simple terms, 3G refers to the third generation of mobile wireless standards that enables a phone to use the most advanced and mature voice and data protocols. According to Morgan Stanley, penetration of 3G mobile technologies is forecasted to increase from 21 percent in 2010 to 43 percent in 2014. Google Inc. s Acquisition of AdMob Social networking. Web 2.0 applications enable consumers to easily and rapidly create online content and stay connected with their friends and family. Through social networking portals such as Facebook, Twitter and others, people can send messages, chat, post comments on their virtual walls, update their status, share videos, music, photos and stories, play games and make voice calls over the Internet. Consumers increasingly want to connect to these sites via the wireless mobile Internet. Video. Just like with desktop Internet, consumers will probably want to find, select, watch and share videos using the mobile Internet; Morgan Stanley estimates that global mobile data traffic will grow at a CAGR of 131% over 2008-2013. Voice over IP. Voice over Internet Protocol enables consumers to chat via voice, messaging and video; most VOIP communication currently occurs over the fixed Internet. With the mobile Internet, consumers will probably want to do the same while they re on the go. Impressive mobile devices. The iPod Touch and Apple s App Store have created the momentum for the mobile Internet, just as Windows 3.0 did for the PC in 1990 and Netscape did for the desktop Internet in 1995. The smartphone share of total handset shipments in 2009 is estimated at 25% in North America, 23% in Western Europe and 52% in Japan. According to a New York Times article by Claire Miller (April 24, 2011), The stakes were high. Mobile phones could be a huge new market for Google. Or they could provide an opening for a competitor to pounce, or obviate the need for a search engine altogether. If people on phones could go straight to apps for information, why Google anything? What are the implications of the significant growth of the mobile Internet for Google? Does this growth imply a significant growth opportunity in mobile Internet advertising? The mobile advertising market Mobile advertising spending The mobile advertising market enables brands, agencies and marketers to reach consumers directly on their mobile phones. Mobile phones are personal devices, which make them a very precise targeting communication tool. Mobile advertising can be used as a stand-alone medium or in cross-media (i.e., TV, print, radio, outdoor, cinema, online and direct mail) campaign plans. When compared with other types of advertising, the mobile advertising market is quite small, with $416 million in 2009 spending. In 2009, online advertising spending was $24 billion, newspaper advertising spending was $38 billion and TV advertising spending was $51 billion (Exhibit 6). Nevertheless, the mobile advertising market is expected to grow at an annual compounded rate of 28% from 2009 to 2013 (Exhibit 7); online advertising grew at an annual rate of 24% over the period 2005-2009. ⒸHEC Montréal 58 2008 $320 Exhibit 6. Advertising Spending in 2005 vs. 2009 (millions) Newspaper Online TV ⒸHEC Montréal $55 400 Google Inc. s Acquisition of AdMob $51 000 $50 200 Source: http://www.emarketer.com/Reports/All/Emarketer_2000591.aspx 2009 $38 000 $416 2010 $24 000 Exhibit 7. U.S. Mobile Advertising Spending, 2008-2013 (millions) $593 $10 000 59 2011 Source: http://www.emarketer.com/Reports/All/Emarketer_2000591.aspx $830 Mobile S- 2012 $416 $1 140 2005 2009 2013 $1560 Mobile advertising channels Multiple channels exist within mobile advertising: mobile websites, mobile applications, mobile messaging, and mobile videos (Exhibit 8). In terms of availability, on one end of the spectrum, there is the mobile messaging channel, which can be used to reach all mobile phone users regardless of whether they have a data service plan or mobile web access capabilities. At the other end there is the mobile video and TV channel, which requires that users have sophisticated video and mobile TV-enabled phones as well as premium-priced service plans. In between sit the mobile web channel and the mobile applications channel. Channel Mobile Web Mobile Applications Mobile Messaging Mobile Video and TV Google Inc. s Acquisition of AdMob ⒸHEC Montréal Exhibit 8. Mobile Advertising Channels Description The mobile web is a channel for delivery of web content, which offers and formats content to users in awareness of the mobile context. The mobile context is characterized by the nature of personal user information needs (e.g, updating your blog, accessing travel information, receiving news updates), constraints of mobile phones (i.e., screen size, keypad input) and special capabilities (i.e., location, connection type such as 3G or WLAN). Software or content that consumers download to or find pre-installed on their mobile phone and then resides on the phone. Examples include applications such as games, newsreaders and lifestyle tools. Downloads are accessible only to consumers with the appropriate mobile phones and data plans. This category includes SMS and Multimedia. Messaging Service (MMS). SMS is available to virtually all mobile phone users and does not typically require a data plan or mobile web access, making it ideal for reaching most mobile users. While SMS is limited to containing text, MMS can contain images, audio and even video content. Video and TV delivered over a mobile network to the mobile phone s media player. Videos may be downloaded or streamed and are usually accessed from a mobile web site or contained in an MMS message. Mobile video is accessible to consumers with mobile web and mobile video- enabled mobile phones and data plans. Mobile TV is accessible through mobile TV-enabled phones. Advertising Opportunities Banner ads on mobile websites Text ads on mobile 60 Websites Branded mobile web sites Good for: Driving users to a mobile website Lead generation Direct sales Branding Ad placement within applications (eg, banners, splash pages) Branded applications Good for: Branding/CRM Driving users to a mobile web site Text ads (SMS, MMS) Branding/CRM (SMS, MMS) Banner ads, splash pages (MMS) Animated images (MMS) Good for: Driving users to a mobile website Click to call Branding/CRM Interactive dialogue (eg, voting, polling) Video ads in pre-roll, mid-roll or post roll Static images, animation or video Clickable overlays Branded videos Driving users to a mobile web site Click to call Click to buy Source: Mobile Marketing Association. Mobile Advertising Overview, January 2009. Good for: Branding/CRM Within the mobile web channel, there are opportunities to provide ad inventory through banner ads on mobile websites, text ads on mobile websites and branded mobile websites. Google. currently dominates the market of text ads on mobile websites by following the same strategy as desktop Internet search advertising: listing text ads that are related to searches performed by users on Google s mobile website. The mobile applications (apps) channel provides ad inventory embedded in software or content that users download to or find pre-installed on their mobile phones. These can be games, newsreaders or lifestyle tools. Market share distribution - Mobile advertising spending In 2009, 55% of mobile advertising spending went to mobile messaging, particularly text messaging, 25% went to mobile websites and mobile applications, and the remaining 20% went to mobile search advertising. 4INFO, Cellfire, HipCricket, ILoopMobile and Verisign Messaging are the major players in text messaging. Google, Yahoo! and Bing dominate search engines, while AdMob, Jumptap, Mojiva, Quattro Wireless and AOL are considered leading mobile advertising networks (Exhibit 9) that serve both mobile websites and mobile applications websites. Select Players: Google Yahoo! Bing Google Inc. s Acquisition of AdMob Exhibit 9. Mobile Advertising Spending for 2009 (estimated) Mobile Advertising Spending, 2009 (est.) Select Players: AdMob Jumptap Mojiva Quattro Wireless AOL/Third Screen Media ⒸHEC Montréal Search 20% Apps & Websites 25% Text Messaging 55% Select Players: 4INFO Cellfire 61 HipCricket iLoopMobile Verisign Messaging Source: http://www.emarketer.com/Reports/All/Emarketer_2000591.aspx Although the mobile applications segment currently accounts for less than 25% of all mobile advertising spending, it is the segment with the greatest growth potential. There are two important factors driving the growth of this channel: first, there is an increased preference for unlimited data plans by customers. Subscribers with unlimited data plans increased from 16% to Source: eMarketer, 9/2009 21% from December 2008 to December 2009. Second, and most important, there is an increasing popularity of smartphones, phones equipped with powerful processors and large displays (e.g., Apple s iPhone, RIM s BlackBerry, and Google s NexusOne). Gartner forecasts that smartphone sales will surpass those of personal computers by 2012. So how large is the growth potential of the mobile applications advertising channel? Chetan Sharma Consulting estimates that mobile application downloads should jump from 7 billion in 2009 to almost 50 billion in 2012. During VentureBeat s MobileBeat 2009 conference, experts predicted that, With 10 million apps, the mobile applications market will be as big as the Internet in 2020. The panel also suggested that by the end of 2009, the market would grow to 100,000 apps. Exhibit 10. 2009 Market Share for Mobile Ad Networks. Total: 279MM. Sériel; Google; $28.00; 10% Série1; Others; $65.93; 24% Google Inc. s Acquisition of AdMob Série1; AOL;- $7.00; 3% Sériel: JumpTap; $11.00; 4% Sériel; Quattro Wireless; $21.00; 8% ⒸHEC Montréal ■ Série1; Microsoft; $23.00; 8% Source: http://www.mediapost.com/publications/?art_aid=117926&fa=Articles.show Article Série1; Yahoo; $32.00; 11% Série1; Millenia Media; $51.00; 18% Série1; Admob; $40.00; 14% Signs of this potential growth are beginning to show. According to Apple, its App Store hit 1.5 billion downloads. AdMob estimated Apple s monthly revenue from app downloads at $200 million or $2.4 billion per year. But AdMob s most important finding is the usage behaviour of users: They are happy spending money on apps for their smartphones, especially after they ve had a chance to try them for free. So who pays for all these free trials? Advertisers. And who links advertisers with app developers? Mobile advertising networks. http://www.mediabuyerplanner.com/entry/49025/mobile-users-increasingly-choose-unlimited-data-plans/. 2 http://mashable.com/2010/03/17/mobile-app-market-17-5-billion/. 3 http://www.businessinsider.com/apps-market-to-be-as-big-as-the-internet-in-2020-with-10-million-apps-2009-7. *http://gigaom.com/2009/08/27/how-big-is-apple-iphone-app-economy-the-answer-might-surprise-you/. 62 Mobile advertising networks Operators and publishers that own mobile websites can sell ads directly or through a third party. as premium inventory or as part of a mobile advertising (ad) network (Exhibit 10). Traditionally, an ad network connected websites that wanted to host advertisements with advertisers who wanted to run advertisements. Recently, ad networks have also been paying software developers for allowing their ads to be shown when people use their software applications. Mobile ad networks can be grouped into three classes: blind networks, premium blind networks and premium networks. This classification takes into account five characteristics: size (in terms of publishers, advertisers or impressions), publishers used to serve ads (independent publishers, independent and premium publishers and prestige publishers only), targeting options (from limited options to plenty of options), capability of advertisers to choose websites (no capability, capability at a premium, and capability), performance advertising options (cost-per-click, cost- per-action, and none), and brand advertising capabilities (limited cost-per-mille, some proportion of cost-per-mille, and predominantly cost-per-mille). Exhibit 11 provides details on the different types of ad networks and identifies the key players in each type of ad network. Exhibit 11. Business Model-Based Classification of Mobile Ad Networks Blind networks Premium networks Premium blind networks Medium-sized Google Inc. s Acquisition of AdMob Size in terms of publishers, advertisers and impressions. Primarily sereves ads through Targeting Options Allows advertisers to choose websites Performance Advertising ⒸHEC Montréal Brand advertising Key Players Largest Independent mobile publishers (sites and applications) By Country & by content channel (news, sports, etc.) Not usually Cost-Per-Click (CPC) is the norm Some, Cost-per- Mille (CPM) ¹ http://en.wikipedia.org/wiki/Advertising_network 2 Source: http://mobithinking.com/mobile-ad-network-guide Higher proportion of premium publishers (i.e. big-traffic mobile sites of well known brands: newspapers, broadcasters or operator portals) Admoda/Adultmoda; Millenial Media; Admob; BuzzCity: Jumptap; Madhouse: InMobi Quattro Wireless Lots At a premium price Some CPC, and some CPA (Cost-per- Action/Acquisition) Higher proportion 63 Smallest Prestiege publishers (mobile operators and big-name destinations). Lots Yes Rarely Every time a consumer clicks on an advertisement, the network charges the advertiser a certain amount; 35 cents, for example. 3 Goes beyond a click and into a specific action once the consumer lands on the advertiser s page. An action could be to fill out a form or purchase a product. Predominant (may be only) Microsoft Mobile Advertising: YOC Group: Advertising.com/AOL: Nokia Interactive Advertising: Pudding Media * A cost-per-mille payment is made for every 1,000 impressions. An impression is registered every time a web page from a content provider pulls the ad from the ad servers and is displayed on the content provider s web page. AdMob Google Inc. s Acquisition of AdMob Omar Hamoui, a visionary entrepreneur, founded AdMob in 2006 in order to remove roadblocks and enable mobile web businesses. AdMob s mission was: To provide the business models, services, tools, and data fundamental to the development and growth of the mobile Internet. AdMob delivered successful advertising results to businesses, regardless of their size or budget, by providing measurable, high return on investing solutions. AdMob s advertising client base (Ford, Coca-Cola, EA, P&G, Land Rover, MTV Europe, Adidas, and Paramount Pictures), mobile web publishers (AccuWeather, BluePulse, CBS Mobile, EA, Flirtomatic, Holliwood.com, Peperonity, and TinyTube) and winning accolades list (Mobile Marketing Association, Ad Age, Business Week, Wired Magazine and the World Economic Forum) reflect its successful business execution capabilities. AdMob developed three top initiatives to help businesses leverage the mobile Internet: Business Models: Through its mobile advertising network (Exhibit 12), AdMob served billions of targeted and personalized ads on the mobile web. This had two main beneficiaries: publishers that monetized their mobile web traffic, and advertisers that targeted and reached customers directly on their mobile devices. Services and Tools: Using AdMob Mobile Analytics (Exhibit 13), mobile website owners could get insight into their traffic and site usage, which in turn enabled them to make data-driven decisions about their mobile businesses. Data: Through its Mobile Metrics Report (Exhibit 14), AdMob shared information about the traffic in their network on an aggregate basis. This report was a snapshot of trends on the mobile Internet. As with most private companies, no public information on AdMob s financial performance was available. According to news reports,¹ by February 2009, AdMob had served 60 billion impressions worldwide since its launch in February 2006. Its display inventory generated 20% of its revenue and the rest came from text ads. Jason Spero, Vice President of Marketing for AdMob, stated in September 2008 that AdMob was charging advertisers 30 to 35 cents per click, or $25 to $30 cost per thousand impressions.² iPhone and Android were creating more mobile apps and more mobile web browsing, which in turn were creating more mobile ad inventory for AdMob to fill. Its gross revenue in November 2009 was approaching $100 million; AdMob s share of this revenue was estimated to be $60 million. ¹ Alex Farber, Answering the call, nma.co.uk, February, 2009. 2 Sarah Reedy, Advertisers Tap iPhone, Telephony, September 2008. ⒸHEC Montréal 64 Google Inc. s Acquisition of AdMob Exhibit 12. AdMob s Mobile Advertising Network Ad Network Advanced Targeting Meets Qualified Traffic AdMob provides innovative solutions for brand and performance advertisers, effective distribution for app developers and revenue opportunities for mobile site owners. Advertisers AdMob provides innovative solutions for brand and performance advertisers to engage your mobile target audience. Learn More Innovative ad formats to meet your unique needs ⒸHEC Montréal App Top Developers admob Connecting the Mobile Ecosystem AdMob provides app developers with a solution to distribute and monetize your apps. Learn More Drive downloads and grow your business Source: http://www.AdMob.com/marketplace Agencies AdMob offers turnkey solutions to help you get your brand in the hands of your target audience no matter where they are: at home, at work, at play, or in transit. Learn More 65 Reach your target audience on the mobile web Publishers Publishing ads on your site with AdMob allows you to monetize your mobile traffic with one of the fastest growing and highest performing networks of advertisers. Learn More Maximize your revenue opportunities C 600 Home Select Site TARTAP ed Real-time Dashboard - AdM x C http://analytics.admob.com/reports/ Apple Of Yahool Google Maps YouTube W Wikipedia AdMob Home Marketplace Analytics Metrics admob Dashboard Visitors Sources Site Usage > Events How often are the reports updated? Most reports for AdMob Mobile Anaytics are updated daily. However the dashboard report is updated periodically throughout the day The last cata point shows the current usage for each particular chart. Al dates and times are GMT Source: ⒸHEC Montréal TapTap-Real-time Dashboard Exhibit 13. AdMob Mobile Analytics Pageviews 174,545 LA Pageviews 12,000 A Google Inc. s Acquisition of AdMob 6,000 Top 5 Content URLs URL -1.43% stedetabuzzY //deals/crush or flush Top 5 Events Evere External Redirect THO Customize Feed Search Register Success http://analytics.admob.com/ /video/details/faceb /site/details/wapking Visits 56,363 A About AdMob Help Contact Terms of Service Privacy Policy Pageviews 5.542 5.340 2.792 2.761 2.360 Occurrences 31,186 5,434 240 189 -0.53% 66 News Dates: Last 30 Days Range: 2010-03-20-2010-04-18 of Total 6.47% 6.23% 3.20% 3.22% 2.75% More... Pageviews per Visit 3.11 www.-1.39% 0 - - Other Bookmarks analyticsdemo@admob.com/Log Out Top 5 Keywords Keywords % of Total 83.66% tap tap 14.56% cospace 0.64% forfree.com Sources by Pageviews Search Engines, 53.15% 0.51% mbuzzy.com 0.49% www.fortree.com More... Average Time Spent 00:02:31 Update Updated periodicaly throughout the day Zoomer: 76 m Pageviews 9,150 5.826 -14.00% 3,622 2,092 2,342 % of Total 10.90% 6.73% 4.34% 3.22% 2.80% More... © 2006-2009 AdMob, Inc Back to Main AdMob Mobile Metrics Our Insights on the Mobile Ecosystem February 2010 Mobile Metrics Report March 25th, 2010 Comments are closed In this month s report, we separate the traffic in our network into three categories-smartphones, feature phones and mobile Internet devices to examine the relative growth rates of each over the past year. Some of the highlights from the report include: Percentage of Traffic 60% 50% • Smartphones accounted for 48% of AdMob s worldwide traffic, up from 35% in February 2009, fueled by heavy application usage on iPhone and Android devices 40% Google Inc. s Acquisition of AdMob Although the share of feature phone traffic in AdMob s network declined from 58% to 35%, the absolute traffic from feature phones still grow 31%. This means that while the overall traffic from feature phones is growing, traffic from smartphones and mobile Intemet devices is growing faster. The mobile Intemet device category experienced the strongest growth of the three, increasing to account for 17% of traffic in AdMob s network in February 2010. Although the vast majority of traffic in this category comes from the Pod touch, the category also includes devices like the Sony PSP and Nintendo DSi Traffic Share by Handset Category, Worldwide AdMob Network 30% Exhibit 14. AdMob s Monthly Mobile Metrics Report 20% 10% 0% P ⒸHEC Montréal Newer Post Previous Post Download Report (PDF) Feb-09 Mar-09 Apr-09 May-09 Jun-09 Jul-09 Aug-09 Sep-09 Oct-09 Nov-09 Dec-09 Jan-10 Feb-10 -Mobile Internet Devices Smartphones -Feature Phones admob Based on a survey we ran last month, 11% of smartphone users are interested in purchasing an Pad. As more mobile Internet devices are introduced into the market, it will be interesting to see how traffic from the category grows relative to smartphones and feature phones. 67 We added trended data and a list of top smartphones to the country data sheets we cover each month. We also removed operator data from the monthly report, but will continue to share it on a regular basis. C Google Inc. s Acquisition of AdMob AdMob received $4 million in a Series A financing from angel investor Michael Dearing in September 2006. Subsequently, several venture capital firms invested in AdMob. It received $15 million in Series B funding from Accel Partners and Sequoia Capital in March 2007. It received $15.7 million in Series C funding from Sequoia Capital and Accel Partners in October 2008, and $12.5 million in Series C funding from Draper Fisher Jurvetson and Northgate Capital in January 2009. AdMob s total funding over the three-year period was $47.2 million. In recent years (according to Dow Jones VentureSource), the median percentage of a company sold in a first round was 40%, 33% in a second round, and 26% in a third or later round. These data can be assumed to apply for the AdMob financing rounds, since ownership stakes actually acquired by investors in AdMob in each funding round were not publicly available. Google s acquisition decision In 2005, DoubleClick was taken private by two private equity firms, Hellman and Friedman and JMI Equity, for $1.1 billion. At the time of the DoubleClick transaction, the mobile advertising market was in its infancy and expected to grow very rapidly. During 2007, several firms in the online advertising market were purchased at multiples between 10 and 15 times annual revenues. Google purchased DoubleClick for $3.1 billion, which was more than 10 times DoubleClick s revenue according to a New York Times article; Microsoft purchased aQuantive at a multiple of 13 times revenue, or about $6.3 billion, resulting in a 85% takeover premium over aQuantive s pre-acquisition stock price; and Yahoo! paid some $680 million for an 80% share of Right Media, which generated about $35 million in revenues in 2006. The acquisitions during this time reflect the intense rivalry between Google, Yahoo!, and Microsoft in seeking strong competitive positions in the online advertising market. Google has historically been an active acquirer, having completed over 100 acquisitions since 2000. While search-related Internet advertising via the personal computer continues to be a major driver of Google s growth, the emergence of the mobile Internet could provide significant opportunities for continuing growth. On May 21, 2010, the Federal Trade Commission (FTC) closed its investigation of Google s acquisition of AdMob, signalling that anti-trust concerns due to this acquisition were not warranted. The FTC stated, Google and AdMob today are the leading competitors among mobile ad networks, which drive the availability of free or low-cost applications and content for smartphones and other mobile devices. Mobile ad networks monetize mobile publishers content by selling publishers advertising space; advertising revenues, in turn, fuel the development of mobile applications and Internet content. Mobile application developers and other publishers rely on mobile ad networks to sell advertising space that they cannot effectively sell on their own. During the investigation, Apple acquired the third largest mobile ad network, Quattro Wireless, in December 2009 and then introduced its own mobile advertising network, iAd, as part of its iPhone applications package. The Commission has reason to believe that Apple quickly will become a strong mobile advertising network competitor. Apple not only has extensive relationships with application developers and users, but also is able to offer targeted ads (heretofore a strength of AdMob) by leveraging proprietary user data gleaned from users of Apple mobile devices. Furthermore, Apple s ownership of the iPhone software development tools, and its control over the developers license ⒸHEC Montréal 68 agreement, gives Apple the unique ability to define how competition among ad networks on the iPhone will occur and evolve. As a result of Apple s entry, AdMob s success to date on the iPhone platform is unlikely to be an accurate predictor of AdMob s competitive significance going forward, whether AdMob is owned by Google or not. This is particularly important given that AdMob s revenue and market share are derived largely from the iPhone platform. (FTC File No. 101-0031) Advertisers need help from firms such as AdMob and its competitors (Exhibit 15) to utilize technology to effectively deliver an ad to a mobile phone. Publishers/site owners often prefer to turn their supply of ad space over to intermediaries such as AdMob and its competitors who are more effective at placing ads. With its acquisition of AdMob for an estimated $750 million, Google is enhancing its presence in the mobile web and mobile advertising segments of the online advertising market. Exhibit 16 provides information on selected Google acquisitions, including offer prices and recent revenue or earnings for the acquired firms; Exhibit 17 provides data on Google s historical profitability drivers, and Exhibit 18 provides capital market data as of May 2010, at the time of the FTC s decision that allowed Google to complete its acquisition of AdMob. ⒸHEC Montréal SMS Ads to: 44636 Pizza Hen Google Inc. s Acquisition of AdMob Merton thead and g 5505place your order now Exhibit 15. Google vs. AdMob Advertising Types of Mobile Advertising Search Ads Web Display Ads App Display Ads 0 Bo Google s Focus Google 69 X- apdogod OO B AdMob s Focus admob 00 Proft Margin Gross Margin Price to earnings ratio Google Inc. s Turnover-control ratios Google Inc. s Profitability Ratios Return on assets Return on invested capital Asset tumover Fixed-Asset tumover Inventory turnover Collection period (in days) Days sales in cash Payables period (in days) Assets to equity Debt to assets Times interest earned Debt to assets (market value) Debt to equity (market value) Current ratio Acit test Acquisition Date Apr-03 Jan-06 ⒸHEC Montréal Oct-06 Mar-07 Apr-07 Jun-07 Jul-08 Aug-09 Nov-09 Feb-10 Mar-10 Google Inc. s levarage and liquidity ratios Exhibit 16. Selected Google Acquisitions of US Companies Acquired Firm Applied Semantics dMarc Broadcasting YouTube Adscape DoubleClick FeedBurner Omnisio On2 AdMob Aardvark DocVerse 12/31/2009 18% 1646 15% 28% 63% 30 12/31/2009 0.6 4.9 na 49.1 377.9 8.9 12/31/2009 1.12 0 na 0.02 0.02 10.62 10.62 Online Advertising Advertising Video Sharing In-game Advertising Online Advertising Web Feed Online Video Video Compression Online Advertising Social Search Microsoft Office File Sharing 12/31/2008 **** 1506 12/31/2008 Google Inc. s Acquisition of AdMob 12/31/2008 Exhibit 17. Google Inc. Historical Profitability Ratios 1.12 Acquired Firm Business 8.77 12/31/2007 1994 17% 15% 25% 50% 52 12/31/2007 0.7 4.1 na 47.6 312.8 15.5 12/31/2007 1.12 0 na 0.01 0.01 8.49 8.49 Offer Price $102 mill. $102 mill. $1.65 bill. $23 mill $3.1 bill $100 mill. $15 mill $124.6 mill. $750 mill. $50 mill $25 mill. 12/31/2006 18% 17% 14% 29% 60% 46 12/31/2006 22 0.6 4.4 na 45.5 387.0 18.2 12/31/2006 1.08 0 na Acquired Firm Revenues 0.01 0.01 10.00 10.00 NA NA $224 mill. ΝΑ $300 mill. ΝΑ ΝΑ $16.3 mill. $45 mill-$60 mill. NA NA 12/31/2005 16% 1496 14% 24% 58% 83 12/31/2005 0.6 6.4 na 40.9 477.7 16.4 12/31/2005 1.09 0 na 0.01 0.01 12.08 12.08 Acquired Firm Earnings NA NA NA NA $50 mill. ΝΑ NA Losses NA NA NA 12/31/2004 149% 12% 14% 13% 54% 132 12/31/2004 10 8.4 na 35.7 244.0 8.2 12/31/2004 1.13 0 na 0.01 0.01 7.91 7.91 12/31/2003 18% 1296 38% 746 5796 0 12/31/2003 17 7.8 na 38.5 83.3 26.9 12/31/2003 1,48 0.002281234 na 1.00 2.38 2.38 12/31/2002 57% 3596 67% 23% 70% 0 12/31/2002 1.5 8.2 na 51.5 121.5 26.1 12/31/2002 1.65 0.022698437 137.61 1.00 2.59 2.59 12/31/2001 ra na na 8% 84% 0 12/31/2001 na na na 0 0 0 12/31/2001 na na 12.22 na na na na 8 p. 70 71 Shares Outstanding Price per Share Equity Market Value of Equity (thousands) Book Value of Equity (thousands) Debt Market Value of Debt Book Value of Debt Risk Free Rate, 1-year Treasury Note: Average for May, 2010 Risk Free Rate, 10-year Treasury Note: Average for May, 2010 Required Market Risk Premium relative to 10-year Treasury Note Beta Google Inc. s Valuation ratios Price / Earnings MV Firm/EBIT (1-Tax rate) Price / Sales MV firm / Sales MV Equity / BV Equity MV firm/BV firm 2013-01-29 ⒸHEC Montréal 12/31/2009 317,772,051 619.98 0 0 $ 197,012.316.18 $ 96,952,969.90 $ 216,375,847.16 $142,287,162.35 $122,935,730.97 $ 51,458,928.43 36,004,224 28,238,862 22,689,679 17,039,840 9,418,957 2,929,056 0.35% 3.42% 5% -6% 1.12 Google Inc. s Acquisition of AdMob 12/31/2009 30.38 30.47 8.33 8.33 5.47 5,47 Exhibit 18. Google Inc. Capital Market Data 12/31/2008 12/31/2007 12/31/2006 12/31/2005 12/31/2004 12/31/2003 315,140,484 312,917,000 308,997,486 296,330,644 266,917,000 160,866,000 307.65 691.48 460.48 414.86 192.79 0 0 12/31/2008 23.11 20.25 4.45 4.45 3.43 3.43 0 0 12/31/2007 52.03 57,44 13.04 13.04 9.54 9.54 23 0 0 12/31/2006 46.33 52.24 13.42 13.42 8.35 8.35 0 0 12/31/2005 82.64 89.07 20.03 20.03 13.05 13.05 0 0 12/31/2004 132.05 130.95 16.14 16.14 17.57 17.57 12/31/2003 12/31/2002 145,346,000 12/31/2002 p. 71 Google Inc Risk Free Rate, 1-year Treasury Note: Average for May, 2010 Risk Free Rate, 10-year Treasury Note: Average for May, 2010 Required Market Risk Premium relative to 10-year Treasury Note Beta Google s estimated ke (based on case Exhibit 18) Adjustment for Size, Liquidity Admobs Cost of Equity Capital Admob s FCF Estimates (in millions) Net Revenues EBIT(1-T) Depreciation Capex Change in NWC Free Cash Flows AdMob s Terminal Value estimates Warranted MV firm / EBIT (1-tax rate), using Google s 2009 multiple Warranted MV firm / Sales, using Googles s 2009 multiple Value of AdMob Using, Warranted MV Firm / EBIT (1-tax rate); as multiple Using, Warranted MV Firm / Sales; as multiple 0.35% 3.42% 5% -6% 1.12 15% ? 31/12/2013 $146.48 $31.29 $10.10 $23.18 $137.24 ? 31/12/2013 31/12/2012 $107.04 $13.97 $7.31 $10.67 $28.45 ? 31/12/2012 31/12/2011 $77.93 $11.83 $5.32 $11.91 $7.56 ? 31/12/2011 31/12/2010 $55.68 $15.35 $2.57 $11.37 $11.34 ? 31/12/2010 31/12/2009 31/12/2009
Expert Answer:
Google Inc Acquisition of AdMob Case Study Analysis With the current forms of the business operations there is a need for any particular firm to make use of technology due to the outstanding competiti... View the full answer


Exploring Strategy Text and Cases
ISBN: 978-1292145129
11th Edition
Authors: Gerry Johnson, Richard Whittington, Patrick RegnÈr, Kevan Scholes, Duncan Angwin
Students also viewed these accounting questions
-
Planning is one of the most important management functions in any business. A front office managers first step in planning should involve determine the departments goals. Planning also includes...
-
Do some amendment and enhance the given research paper: Table of Content Abstract..3 Action Research.4 Research Methodology and Design...5 Literature Review: NoSQL Database7 Proposal.7 Iteration 1..8...
-
Emerson Electric Company was founded in 1890 as a manufacturer of motors and fans. In 1993, Emerson marked its thirty-sixth consecutive year of improved earnings per share. On $8.2 billion sales, the...
-
A heating contractor must heat 0.2 kg/s of water from 15C to 35C using hot gases in cross flow over a thin-walled tube. Your assignment is to develop a series of design graphs that can be used to...
-
What is a subtype discriminator? Given an example of its use.
-
Describe the geometry and hybridization about a carbon atom that forms a. Four single bonds. b. Two single bonds and one double bond. c. One single bond and one triple bond.
-
Develop the questionnaire in Internet Exercise 8-21 using an electronic questionnaire design package that is available for free (see the websites mentioned in this chapter in the subsection entitled...
-
Wilkins, a resident of and licensed by the State of Texas as a certified public accountant (CPA), rendered service in his professional capacity in Louisiana to Coverton Cosmetics Company. He was not...
-
Machine hours and electricity costs for Wells Industries for the most recent year are as follows: Month Machine Hours Electricity Costs January 2,000 $9,221 February 2,320 $10,500 March 1,520 $6,774...
-
Westley Fong, manager of The Lucky 88 Motel, has a contract with Appraisers Associates to appraise his 150-room motel, which is located in beautiful downtown Wahiawa. The consultant on the job has...
-
Two objects are moving towards each other with velocities V and V, on a frictionless surface. They collide completely inelastically and move together after the collision with a velocity |V3|= 15.3...
-
The contra-asset account, Contra Depreciation Depreciation Expense Equipment Accumulated Depreciation Accumulated Expense Accumulated Accretion is used to record depreciation on equipment.
-
use this initial code to complete java code Skyscraper.java import java.io.FileNotFoundException;/** * Reads in configurations of potential solutions to Skyscraper puzzles and * evaluates their...
-
Background For many, Easter is a time for receiving chocolate eggs. Large ones, small ones, solid ones, hollow ones, filled ones. Dark chocolate ones, milk chocolate ones, white chocolate ones....
-
solve all the attachments What is implied by a serializable request for at least two exchanges? [2 marks] (b) Explain how timestamp requesting (TSO) upholds segregation. [5 marks] (c) Draw and make...
-
I am learning to program a game engine which is why I followed a tutorial, with that tutorial I have gotten this far and even though my code is identical to theirs (theirs did work in the videos) its...
-
Write the octal equivalents for the following binary numbers:100,111,101,011, and 010. Write how to express*nix owner permissions of r-x in binary (Remember that the -symbol means the permission isnt...
-
Audrey purchases a riding lawnmower using a 2-year, no-interest deferred payment plan at Lawn Depot for x dollars. There was a down payment of d dollars and a monthly payment of m dollars. Express...
-
1. What would be the attractions of this job for you? What would be the disadvantages? 2. What relevant skills and experience do you already have, and what skills and experience would you still need...
-
What skills and experiences should a recruiter look for in hiring each of five types of strategist identified above?
-
1. Identify the various change levers (Section 15.5) used by these five leaders. 2. Do you think that a diabetes charity or the US military have anything to teach business organisations about change?
-
A trap-jaw ant has mandibles that can snap shut with some force, as you might expect from its name. The formidable snap is good for more than capturing prey. When an ant snaps its jaws against the...
-
Cress Trust owns houses in Marion County, for whom Rainbow Realty Group, Inc., sells, rents, and manages. The same person serves as Rainbows president and Cresss corporate trustee. Cress offers four...
-
Genevieve and William Timmons began their tenancy of a ground-floor apartment at Cobblestone Square in September 2011. Kingsley-Johnston, Inc., is a property management company responsible for...

Study smarter with the SolutionInn App