

Question: case study Hewlett-Packard Hewlett-Packards procurement risk management programme is estimated to have saved the company $100 million over five years. Its main use is to
case study
Hewlett-Packard Hewlett-Packards procurement risk management programme is estimated to have saved the company $100 million over five years. Its main use is to assess the risks to supplies of its component, based on: uncertainty in demand; cost of components; availability of components. Each of these is analysed for uncertainty and risk, with forecasts made of future performance. Then managers assess the risk for each component and assign it a score, together with a review of the availability and costs of materials used to make the components. This information is used to prioritize risks and proactively manage the risk associated with each component. Options for dealing with the risk range from agreements to share risks with suppliers through to switching to new, less risky suppliers.
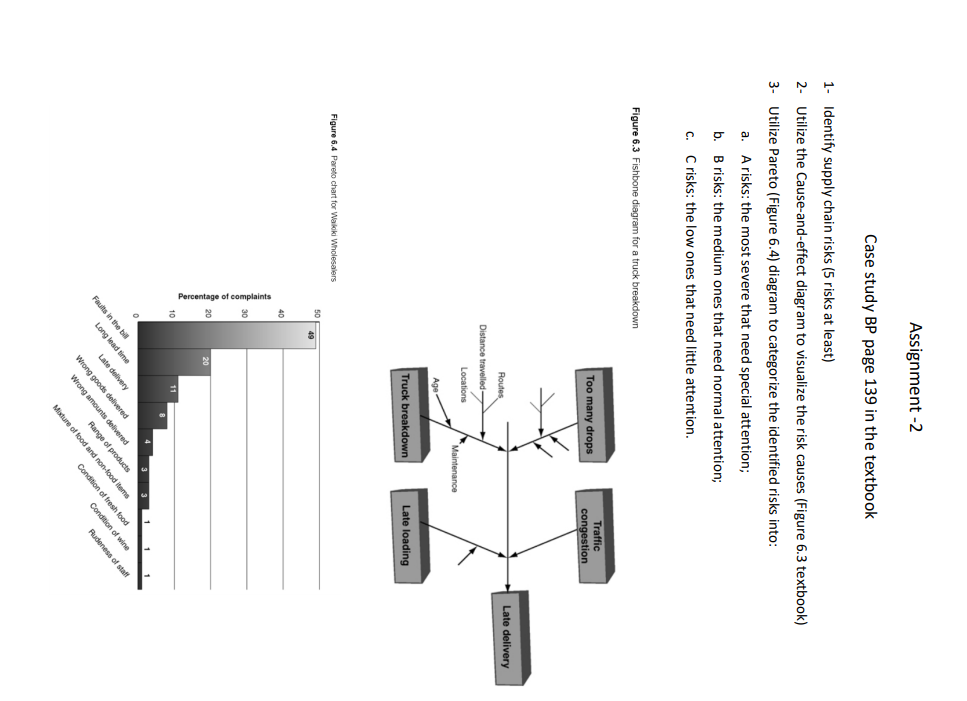
Assignment -2 Case study BP page 139 in the textbook 1- Identify supply chain risks (5 risks at least) 2- Utilize the Cause-and-effect diagram to visualize the risk causes (Figure 6.3 textbook) 3- Utilize Pareto (Figure 6.4) diagram to categorize the identified risks into: a. A risks: the most severe that need special attention; b B risks: the medium ones that need normal attention; C. Crisks: the low ones that need little attention. Figure 6.3 Fishbone diagram for a truck breakdown Too many drops Traffic congestion Late delivery Routes Distance travelled Locations Maintenance Age Truck breakdown Late loading Figure 6.4 Pareto chart for Walcki Wholesalers 50 49 Percentage of complaints 20 1 Faults in the bi Long lead time Late delivery Wrong goods delivered Wrong amounts delivered Range of products Mixture of food and non-food items Condition of fresh food Condition of wine Rudeness of staff Assignment -2 Case study BP page 139 in the textbook 1- Identify supply chain risks (5 risks at least) 2- Utilize the Cause-and-effect diagram to visualize the risk causes (Figure 6.3 textbook) 3- Utilize Pareto (Figure 6.4) diagram to categorize the identified risks into: a. A risks: the most severe that need special attention; b B risks: the medium ones that need normal attention; C. Crisks: the low ones that need little attention. Figure 6.3 Fishbone diagram for a truck breakdown Too many drops Traffic congestion Late delivery Routes Distance travelled Locations Maintenance Age Truck breakdown Late loading Figure 6.4 Pareto chart for Walcki Wholesalers 50 49 Percentage of complaints 20 1 Faults in the bi Long lead time Late delivery Wrong goods delivered Wrong amounts delivered Range of products Mixture of food and non-food items Condition of fresh food Condition of wine Rudeness of staff
Step by Step Solution
There are 3 Steps involved in it

Get step-by-step solutions from verified subject matter experts