

Question: Case Study Questions 1. Convert flight hour and cycle interval to day terms using the provided utilization. 2. Determine the driving time limit for each
Case Study Questions 1. Convert flight hour and cycle interval to day terms using the provided utilization. 2. Determine the driving time limit for each check. 3. Determine the actual frequency each check will be accomplished using a 95% yield on driving interval. 4. With 1 aircraft what is the average number events that need to be accomplished each year for each check? 5. With 1 aircraft what is the average events per month for each check? 6. With 1 aircraft what is the average events per day for each check? 7. What is the average number of events for each check that must be accomplished each day considering the fleet size in years 1 to 5? 8. What are the total man-hours required for hangar and line maintenance checks considering the fleet counts in years 1 to 5? 9. How many mechanics are required to generate to the forecasted man-hours required? 10. Assuming that there are 30 mechanics on staff in what years will the company need to hire additional mechanics and how many? 11. Assuming that you currently have only one hangar bay in what year will need to add more hangar capacity? 12. What is the current need for mechanics in each maintenance location? 13. What will be the staffing demand for each location as the fleet grows? Assume that any additional hangar space will be added in Miami.
Final Exercise Using the data produced by answering the above questions produce an outline for a potential presentation for Maintenance & Engineering senior leadership to accomplish the following: 1) A summary of the forecasting methodology and key inputs to the forecast 2) A summary of the forecast outputs that would be of interest to senior leadership 3) Recommendations for the timing and amount of resources to be added
adding picture of demo solution
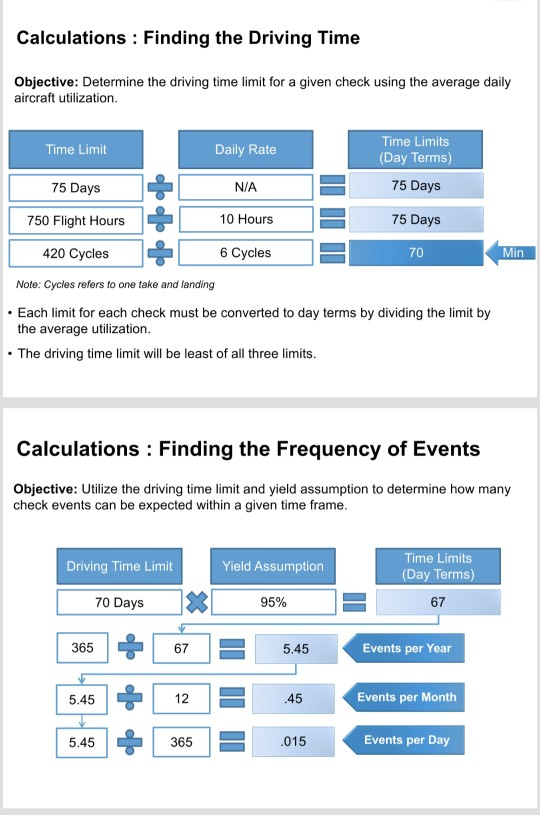
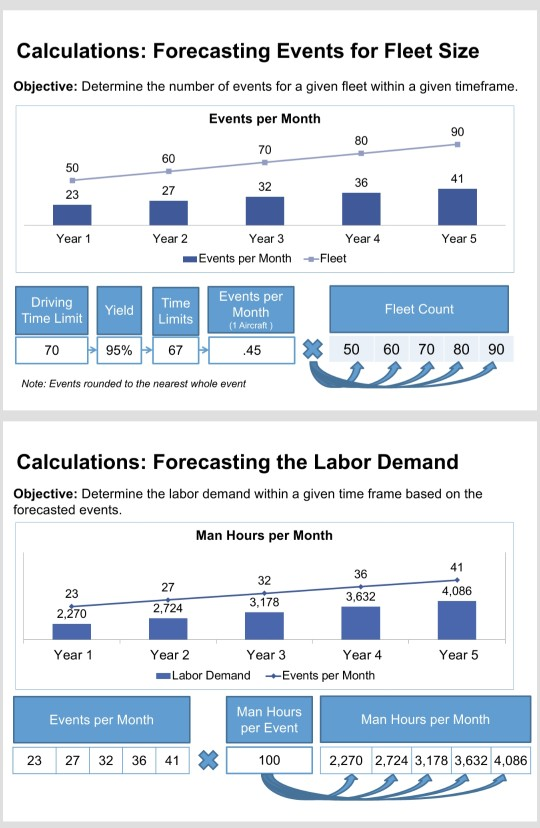
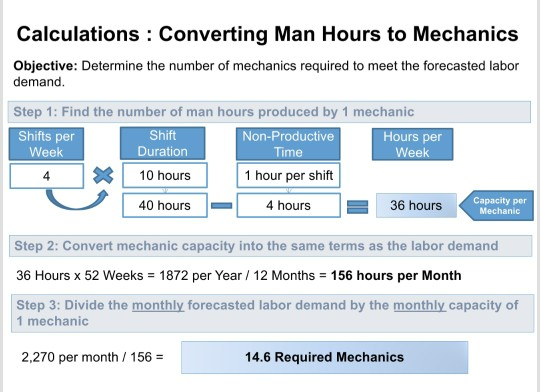
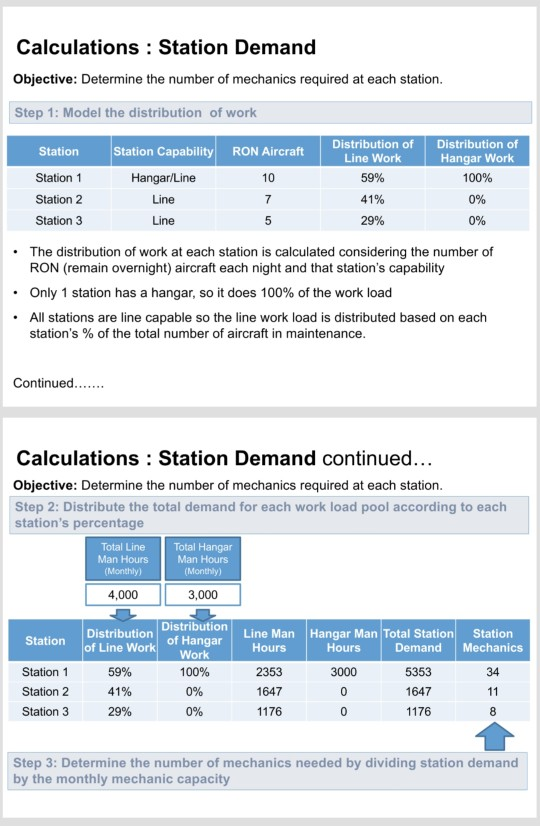
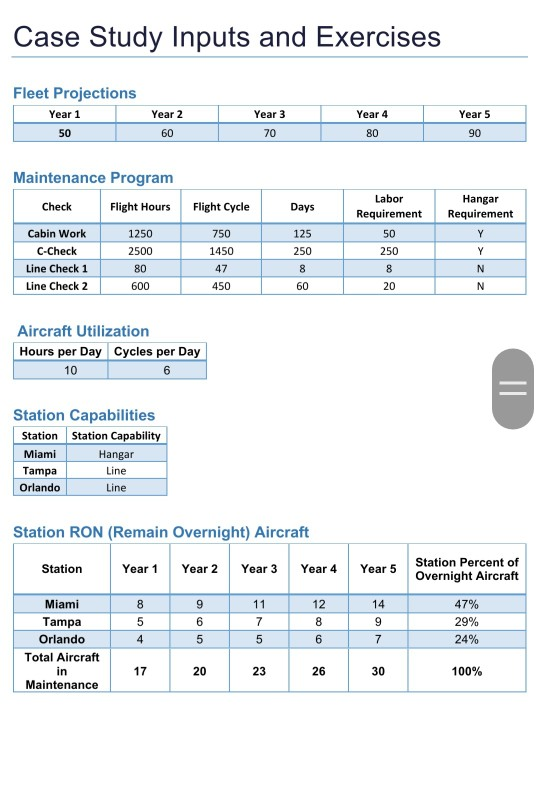
Synopsis: Vacation Express Airlines is the latest in up and coming Ultra-Low Cost Carriers (ULCCs) that have been steadily building on a niche market for low fare travel to vacation destinations. The company strategy involves being aggressive, nimble and innovative by identifying opportunities to grow the business and make quick but well thought out decisions. The current fleet consists of 50 B737-700 but if more aircraft can be acquired at the right price point, there could be significant growth opportunities over the next five years. The Fleet Transactions department is working on a deal to acquire aircraft coming off lease in in the next five years. You are the Manager of Line Maintenance Planning and the senior leadership of Maintenance & Engineering has confirmed that Vacation Express will almost be doubling its fleet over the next five years to support aggressive growth in along the northeast to vacation destinations in Florida. You have been tasked with producing a forecast of maintenance demand to assist senior leadership developing a plan for adding the needed capacity and designing a maintenance footprint that will support the Network Plan as the fleet grows. Learning Objectives: 1. Gain a basic understanding of check intervals and Maintenance Planning concepts 2. Provide students with a method for estimating resource requirements for a RON (remain overnight) maintenance 3. Gain the ability to generate forecasts and make recommendations to support management decision making Concepts Demonstrated in Exercises Aircraft utilization and the relationship with the driving time limit of check intervals Event based forecasting using check intervals Check yield management and the associated implications within an RON setting Labor demand distribution across a network of maintenance bases with varying capabilities Estimating hangar and labor capacity Case Study Inputs and Exercises Fleet Projections Year 1 50 Year 2 60 Year 3 70 Year 4 80 Year 5 90 Maintenance Program Check Flight Hours Flight Cycle Days Labor Requirement Hangar Requirement 50 125 250 Cabin Work C-Check Line Check 1 Line Check 2 1250 2500 8 0 600 750 1450 478 450 250 8 20 N N 60 Aircraft Utilization Hours per Day Cycles per Day 10 Station Capabilities Station Station Capability Miami Hangar Tampa Line Orlando Line Station RON (Remain Overnight) Aircraft Station Year 1 Year 2 Year 3 Year 4 Year 5 Station Percent of Overnight Aircraft 12 Miami Tampa 11 7 8 6 47% 29% 24% Orlando Total Aircraft in Maintenance 17 20 23 26 30 100% Calculations : Finding the Driving Time Objective: Determine the driving time limit for a given check using the average daily aircraft utilization. Time Limit Daily Rate Time Limits (Day Terms) 75 Days N/A 75 Days 750 Flight Hours 10 Hours 75 Days 420 Cycles 6 Cycles 70 Min Note: Cycles refers to one take and landing Each limit for each check must be converted to day terms by dividing the limit by the average utilization. The driving time limit will be least of all three limits. Calculations : Finding the Frequency of Events Objective: Utilize the driving time limit and yield assumption to determine how many check events can be expected within a given time frame. Driving Time Limit Yield Assumption Time Limits (Day Terms) 67 70 Days 95% = 365 + 67 = 5.45 Events per Year 5.45 12 .45 Events per Month 5.45 5.45 + 365 = .015 Events per Day Calculations: Forecasting Events for Fleet Size Objective: Determine the number of events for a given fleet within a given timeframe. Events per Month 50 60 70 23 27 36 32 Year 1 Year 2 Year 5 Year 3 Events per Month Year 4 -Fleet Driving Time Limit Yield Time Limits Events per Month (1 Aircraft) Fleet Count 70 95% 67 .45 X 50 60 70 80 90 Note: Events rounded to the nearest whole event Calculations: Forecasting the Labor Demand Objective: Determine the labor demand within a given time frame based on the forecasted events. Man Hours per Month 36 23 27 32 3.178 4,086 3,632 2,270 2,724 Year 1 Year 5 Year 2 Year 3 Year 4 Labor Demand Events per Month Events per Month Man Hours per Event Man Hours per Month 23 27 32 36 41 X 100 2,270 2,724 3,178 3,632 4,086 2.270 2,724 3.178 2,032 4,086 Calculations : Converting Man Hours to Mechanics Objective: Determine the number of mechanics required to meet the forecasted labor demand. Step 1: Find the number of man hours produced by 1 mechanic Shifts per Shift Non-Productive Hours per Week Duration Time Week 10 hours 1 hour per shift | 40 hours 4 hours E 36 hours Capacity per Mechanic Step 2: Convert mechanic capacity into the same terms as the labor demand 36 Hours x 52 Weeks = 1872 per Year / 12 Months = 156 hours per Month Step 3: Divide the monthly forecasted labor demand by the monthly capacity of 1 mechanic 2,270 per month / 156 = 14.6 Required Mechanics Calculations : Station Demand Objective: Determine the number of mechanics required at each station Step 1: Model the distribution of work Station Station Capability RON Aircraft Station 1 Distribution of Line Work 59% 41% 29% Hangar/Line Line Line Distribution of Hangar Work 100% 0% 0% Station 2 Station 3 The distribution of work at each station is calculated considering the number of RON (remain overnight) aircraft each night and that station's capability Only 1 station has a hangar, so it does 100% of the work load All stations are line capable so the line work load is distributed based on each station's % of the total number of aircraft in maintenance. Continued....... Calculations : Station Demand continued... Objective: Determine the number of mechanics required at each station Step 2: Distribute the total demand for each work load pool according to each station's percentage Total Line Man Hours (Monthly) Total Hangar Man Hours (Monthly) 4,000 3,000 Station Line Man Hours Hangar Man Total Station Hours Demand Station Mechanics Station 1 Station 2 Station 3 Distribution Distribution of Line Work of Hangar Work 59% 100% 41% 0% 29% 0% 2353 1647 1176 3000 0 5353 1647 1176 Step 3: Determine the number of mechanics needed by dividing station demand by the monthly mechanic capacity
Step by Step Solution
There are 3 Steps involved in it

Get step-by-step solutions from verified subject matter experts