

Question: Case Study: Tesla Cost Analysis completed on an Excel tab that outlines the cost that will be incurred to implement the strategy. This information should
Case Study: Tesla
Cost Analysis completed on an Excel tab that outlines the cost that will be incurred to implement the strategy. This information should correspond with the With Strategy on the Projected Financial Statements, linking of cells to the financial statements is encouraged.
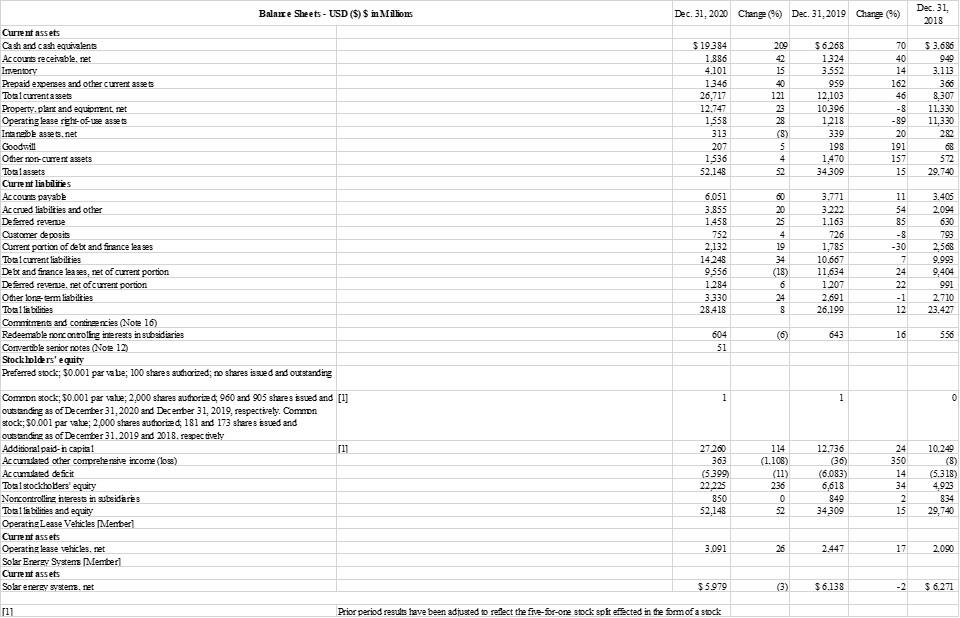
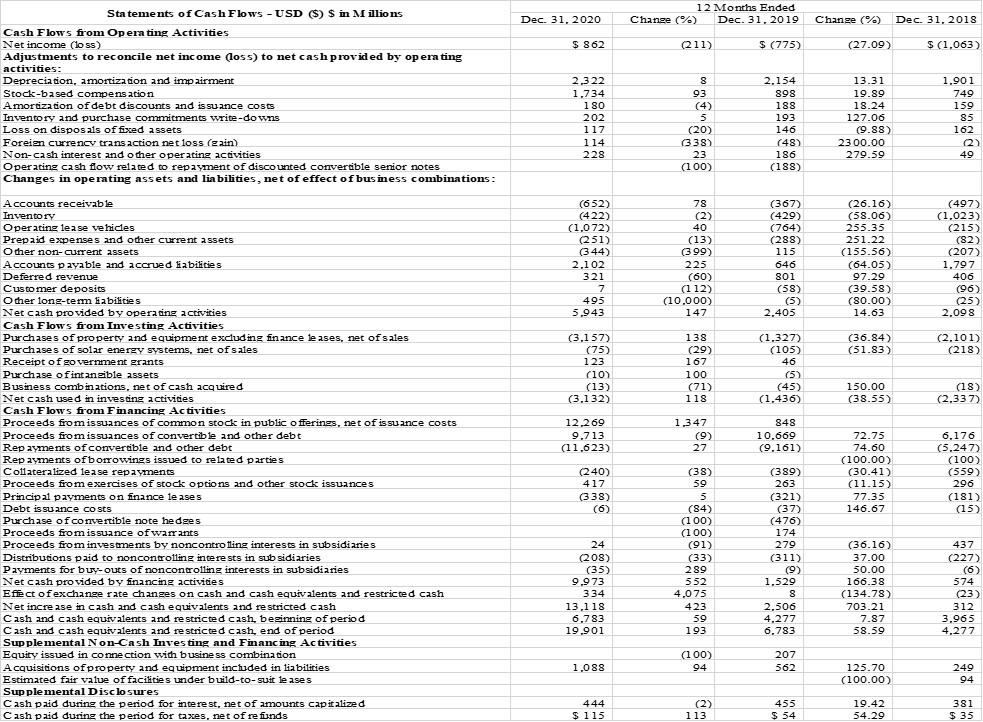
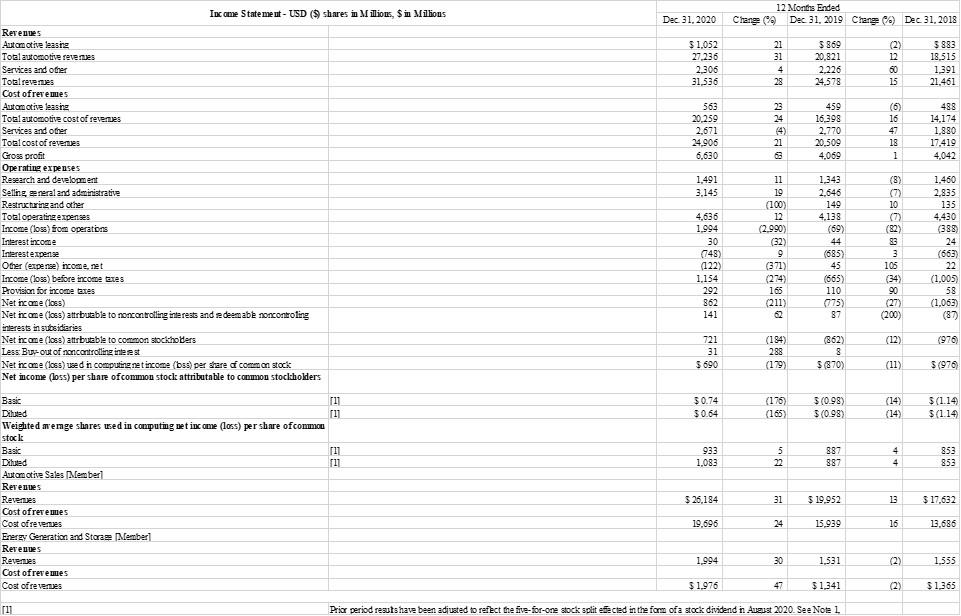
Dec 31, Balance Sheets - USD ($) $ in Millions Dec. 31. 2020 Chang (%6) Dec 31, 2019 Chang (%) 2018 $19.384 1.886 4.101 1346 26,717 12.747 1.558 313 207 1.536 52.148 209 42 15 40 121 23 28 (8) 5 4 52 $ 6.268 1324 3.552 959 12.103 10.396 1.218 339 198 1.470 34309 70 40 14 162 46 -8 -89 20 191 157 15 $ 3.686 949 3.113 366 8,307 11.330 11,330 282 68 572 29.740 3.405 2.094 630 709 Current assets Cash and cash equivalents Accounts receivable.net Inventory Prepaid expenses and other current assets Total current assets Property.plant and equipment net Operating tease right-of-use ases Intangibt es. net Goodwill Other nor current assets Total assets Current liabilities Accounts payable Accrued liabilties and other Deared revenue Customer deposits Current portion of debt and finance les ses Total current liabilties Debt and finance teases, net of current portion De red revenue. set of current portion Other long-erm liabilties Totallibilities Commitments and continencies (Noe 16) Redeemable noncontroling interests in subsidiaries Convertible senior notes (Note 12) Stockholders' equity Preferred stock; 50.001 par va be; 100 shares authorized; no shares issued and outstanding Common stock: 90.001 par vate: 2.000 shares authorized 960 and 905 shares Esved and [1] ousanding as of December 31, 2020 and December 31, 2019. respectirely. Comon stock: 50.001 par value: 2,000 shares authorized: 181 and 173 shares issued and Over andeng as of December 31.2019 and 2018. seppecively Additional paid- in capital 111 Accumulated other comprehensive income (los) Accumulated deficit Tot i stockholders' equiry Noncontrolling interests in subsidores Tosila bilities and equity Operating Lease Vehicles Menter Current assets Operating lease vehicles.net Solar Enerzy Systems Member Current assets Solar energy systems. net 6.051 3.855 1.458 752 2.132 14248 9.556 1.284 3330 28.418 60 20 25 4 19 34 (18) 6 24 8 3.771 3.222 1.163 726 1.785 10.667 11.634 1.207 2.691 26.199 11 54 85 - 8 -30 7 24 22 -1 12 2.568 9.993 9,404 991 2.710 23.427 (6) 643 16 604 51 356 1 1 0 27.260 363 (5399) 22.225 850 52.148 114 (1.108) (11) 236 0 52 12.736 (36) (6.083) 6,618 849 34309 24 350 14 34 2 15 10.240 (8) (5.318) 4,923 834 29,740 3.091 26 2.447 17 2.090 $5.979 (3) $6.138 -2 $ 6.271 11 Prior period results have been adjusted to reflect the fre-for-one stock spit effected in the form of a stock Dec. 31, 2020 12 Months Ended Change (%) Dec. 31, 2019 Change (%) Dec. 31. 2018 $ 862 (211) $ (775) (27.09) $ (1,063) Statements of Cash Flows - USD ($) Sin Millions Cash Flows from Operating Activities Net income (loss) Adjustments to reconcile net income (loss) to net cash provided by operating activities: Depreciation, amortization and impairment Stock-based compensation Amortization of debt discounts and issuance costs Inventory and purchase commitments write-downs Loss on disposals of fixed assets Foreisn currency transaction net loss (ain) Non-cash interest and other operating activities Operating cash flow related to repayment of discounted convertible senior notes Changes in operating assets and liabilities, net of effect of business combinations: 2,322 1,734 180 202 117 114 228 8 8 93 (4) 5 (20) (338) 23 (100) 2.154 898 188 193 146 (48) 186 (188) ) 13.31 19.89 18.24 127.06 (9.88) 23 00.00 279.59 1,901 749 159 85 162 02 49 (652) (422) (1,072) (251) (344) 2.102 321 7 495 5.943 78 (2) 40 (13) (399) 225 (60) (112) (10,000) 147 (367) (429) (764) (288) 115 646 801 (58) (5) 2.405 (26.16) (58.06) 255.35 251.22 (155.56) (64.05 ) 97.29 (39.58) (80.00) 14.63 (497) (1,023) (215) (82) (207) 1.797 406 (96). (25) 2,098 (36.84) (51.83) (2,101) (218) (3,157) (75) 123 (10) (13) (3.132) 138 (29) 167 100 (71) 118 (1.327) (105) 46 (5) (45) (1.436) 150.00 (38.55) (18) (2,337) 12,269 9.713 (11.623) 1,347 (9) 27 848 10.669 (9.161) Accounts receivable Inventory Operating lea se vehicles Prepaid expenses and other current assets Other non-current assets Accounts payable and accrued liabilities Deferred revenue Customer deposits Other long-tem liabilities Net cash provided by operating activities Cash Flows from Investing Activities Purchases of property and equipment excluding finance te ases, net of sales Purchases of solar energy systems, net of sales Receipt of government grants Purchase of intangible assets Business combinations, net of cash acquired Net cash used in investing activities Cash Flows from Financing Activities Proceeds from issuances of common stock in public offerings, net of issuance costs Proceeds from issuances of convertible and other debt Repayments of convertible and other debt Rep ayments of borrowings issued to related parties Collateralized lease repayments Proceeds from exercises of stock options and other stock issuances Principal payments on finance le ases Debt is suance costs Purchase of convertible note hedges Proceeds from issuance of warrants Proceeds from investments by noncontrolling interests in subsidiaries Distributions paid to noncontrolling interests in subsidiaries Payments for buy-outs of noncontrolling interests in subsidiaries Net cash provided by financing activities Effect of exchange rate changes on cash and cash equivalents and restricted cash Net increase in cash and cash equivalents and restricted cash Cash and cash equivalents and restricted cash, beginning of period Cash and cash equivalents and restricted cash, end of period Supplemental Non-Cash Investing and Financing Activities Equity issued in comection with business combination Acquisitions ofproperty and equipment included in liabilities Estimated fair value of facilities under build-to-suit le ases Supplemental Disclosures Cash paid during the period for interest, net of amounts capitalized Cash paid during the period for taxes, net of re fiinds 72.75 74.60 (100.00) (30.41) (240) 417 (338) (6) 6,176 (5,247) (100) (559) 296 (181) (15) (11.15) 77.35 146.67 24 (208) (35) 9,973 334 13,1 18 6.783 19,901 (38) 59 5 (84) (100) (100) (91) (33) 289 552 4,075 423 59 193 (389) 263 (321) (37) (476) 174 279 (311) (9) 1,529 8 2,506 4,277 6.783 (36.16) 37.00 50.00 166.38 (134.78) 703.21 7.87 58.59 437 (227) (6) 574 (23) 312 3,965 4,277 (100) 94 207 562 1,088 125.70 (100.00) 249 94 444 $ 115 (2) 113 455 $ 54 19.42 54.29 381 $ 35 Income Statement - USD ($) shares in Millions, $ in Millions Dec 31, 2020 12 Months Ended Chang (Dec 31, 2019 Change Dec 31, 2018 $1,052 27.236 2.306 31,536 21 31 4 28 5869 20.821 2.226 24,578 (2) 12 60 15 5883 18515 1.391 21.461 563 20.259 2.671 24,906 6,630 23 24 (4) 21 459 16,398 2,770 20,509 4.069 (6) 16 47 18 1 488 14,174 1,880 17,419 4,042 1.491 3.145 Revenues Automotive leasing Total automotive revenues Services and other Tost revenues Cost ofrey emes Automotive leasing Toal automotive cost of revenues Services and other Total cost of revenues Gross profit Operating expenses Research and development Selling eneral and administrative Restructuring and other Total operating expenses Income (los) from operations Invest income Interestexpense Other (expense) income.net Income (los) before income taxes Provision for income taxes Net home (los) Net icone (los) attrbutable to moncontrotting interests and a deemabe noncontroling interests in subsidiaries Net income (loss) attrbutable to common stockhobers Less Bur out of non controlling interest Net income (los) used in computing net income (bs) per share a common stock Net income (loss) per share of common stock attributable to common stockholders 11 19 (100) 12 (2.990) (32) 9 (371) (274) 165 (211) 62 4,636 1.994 30 748) 122 1,154 292 862 141 1,343 2,646 149 4,138 (69) 44 (585) 45 (665) 110 0975) 87 cara 64-669cm 868 a (8) (0) 10 (7) (82 83 3 105 34 90 1.460 2,835 135 4.430 (388) 24 (663) 22 (1,005) 5 (1,063) (87) (200) (12) (976) 721 31 $ 690 (184) 288 (179) (862) 8 S (870) (11) $(976 $0.74 30.64 (176) (165) $(0.98) S(0.98) (14) (14) $(1.14 $(1.14 933 1,083 5 5 22 887 887 4 4 853 853 Basic 11 Diluted 11 Weighted average shares used in computing net in cme (loss) per share of common stock Basic 11 Diluted 11 Automotive Sales Member Revenues Revenues Cost ofreremes Cost of revenues Energy Generation and Stora Member Rerences Revenues Cost of reve mes Cost of revenues $ 26,184 31 $ 19,952 13 $ 17,632 19,696 24 15,939 16 13,686 1,994 30 1,531 (2) 1.555 $1.976 47 $ 1.341 (2) $ 1.365 111 Prior period resuts have been adjusted to reflect the five-for-one stock split efected in the form of a stock dividend in Auzust 2020. See Noel Dec 31, Balance Sheets - USD ($) $ in Millions Dec. 31. 2020 Chang (%6) Dec 31, 2019 Chang (%) 2018 $19.384 1.886 4.101 1346 26,717 12.747 1.558 313 207 1.536 52.148 209 42 15 40 121 23 28 (8) 5 4 52 $ 6.268 1324 3.552 959 12.103 10.396 1.218 339 198 1.470 34309 70 40 14 162 46 -8 -89 20 191 157 15 $ 3.686 949 3.113 366 8,307 11.330 11,330 282 68 572 29.740 3.405 2.094 630 709 Current assets Cash and cash equivalents Accounts receivable.net Inventory Prepaid expenses and other current assets Total current assets Property.plant and equipment net Operating tease right-of-use ases Intangibt es. net Goodwill Other nor current assets Total assets Current liabilities Accounts payable Accrued liabilties and other Deared revenue Customer deposits Current portion of debt and finance les ses Total current liabilties Debt and finance teases, net of current portion De red revenue. set of current portion Other long-erm liabilties Totallibilities Commitments and continencies (Noe 16) Redeemable noncontroling interests in subsidiaries Convertible senior notes (Note 12) Stockholders' equity Preferred stock; 50.001 par va be; 100 shares authorized; no shares issued and outstanding Common stock: 90.001 par vate: 2.000 shares authorized 960 and 905 shares Esved and [1] ousanding as of December 31, 2020 and December 31, 2019. respectirely. Comon stock: 50.001 par value: 2,000 shares authorized: 181 and 173 shares issued and Over andeng as of December 31.2019 and 2018. seppecively Additional paid- in capital 111 Accumulated other comprehensive income (los) Accumulated deficit Tot i stockholders' equiry Noncontrolling interests in subsidores Tosila bilities and equity Operating Lease Vehicles Menter Current assets Operating lease vehicles.net Solar Enerzy Systems Member Current assets Solar energy systems. net 6.051 3.855 1.458 752 2.132 14248 9.556 1.284 3330 28.418 60 20 25 4 19 34 (18) 6 24 8 3.771 3.222 1.163 726 1.785 10.667 11.634 1.207 2.691 26.199 11 54 85 - 8 -30 7 24 22 -1 12 2.568 9.993 9,404 991 2.710 23.427 (6) 643 16 604 51 356 1 1 0 27.260 363 (5399) 22.225 850 52.148 114 (1.108) (11) 236 0 52 12.736 (36) (6.083) 6,618 849 34309 24 350 14 34 2 15 10.240 (8) (5.318) 4,923 834 29,740 3.091 26 2.447 17 2.090 $5.979 (3) $6.138 -2 $ 6.271 11 Prior period results have been adjusted to reflect the fre-for-one stock spit effected in the form of a stock Dec. 31, 2020 12 Months Ended Change (%) Dec. 31, 2019 Change (%) Dec. 31. 2018 $ 862 (211) $ (775) (27.09) $ (1,063) Statements of Cash Flows - USD ($) Sin Millions Cash Flows from Operating Activities Net income (loss) Adjustments to reconcile net income (loss) to net cash provided by operating activities: Depreciation, amortization and impairment Stock-based compensation Amortization of debt discounts and issuance costs Inventory and purchase commitments write-downs Loss on disposals of fixed assets Foreisn currency transaction net loss (ain) Non-cash interest and other operating activities Operating cash flow related to repayment of discounted convertible senior notes Changes in operating assets and liabilities, net of effect of business combinations: 2,322 1,734 180 202 117 114 228 8 8 93 (4) 5 (20) (338) 23 (100) 2.154 898 188 193 146 (48) 186 (188) ) 13.31 19.89 18.24 127.06 (9.88) 23 00.00 279.59 1,901 749 159 85 162 02 49 (652) (422) (1,072) (251) (344) 2.102 321 7 495 5.943 78 (2) 40 (13) (399) 225 (60) (112) (10,000) 147 (367) (429) (764) (288) 115 646 801 (58) (5) 2.405 (26.16) (58.06) 255.35 251.22 (155.56) (64.05 ) 97.29 (39.58) (80.00) 14.63 (497) (1,023) (215) (82) (207) 1.797 406 (96). (25) 2,098 (36.84) (51.83) (2,101) (218) (3,157) (75) 123 (10) (13) (3.132) 138 (29) 167 100 (71) 118 (1.327) (105) 46 (5) (45) (1.436) 150.00 (38.55) (18) (2,337) 12,269 9.713 (11.623) 1,347 (9) 27 848 10.669 (9.161) Accounts receivable Inventory Operating lea se vehicles Prepaid expenses and other current assets Other non-current assets Accounts payable and accrued liabilities Deferred revenue Customer deposits Other long-tem liabilities Net cash provided by operating activities Cash Flows from Investing Activities Purchases of property and equipment excluding finance te ases, net of sales Purchases of solar energy systems, net of sales Receipt of government grants Purchase of intangible assets Business combinations, net of cash acquired Net cash used in investing activities Cash Flows from Financing Activities Proceeds from issuances of common stock in public offerings, net of issuance costs Proceeds from issuances of convertible and other debt Repayments of convertible and other debt Rep ayments of borrowings issued to related parties Collateralized lease repayments Proceeds from exercises of stock options and other stock issuances Principal payments on finance le ases Debt is suance costs Purchase of convertible note hedges Proceeds from issuance of warrants Proceeds from investments by noncontrolling interests in subsidiaries Distributions paid to noncontrolling interests in subsidiaries Payments for buy-outs of noncontrolling interests in subsidiaries Net cash provided by financing activities Effect of exchange rate changes on cash and cash equivalents and restricted cash Net increase in cash and cash equivalents and restricted cash Cash and cash equivalents and restricted cash, beginning of period Cash and cash equivalents and restricted cash, end of period Supplemental Non-Cash Investing and Financing Activities Equity issued in comection with business combination Acquisitions ofproperty and equipment included in liabilities Estimated fair value of facilities under build-to-suit le ases Supplemental Disclosures Cash paid during the period for interest, net of amounts capitalized Cash paid during the period for taxes, net of re fiinds 72.75 74.60 (100.00) (30.41) (240) 417 (338) (6) 6,176 (5,247) (100) (559) 296 (181) (15) (11.15) 77.35 146.67 24 (208) (35) 9,973 334 13,1 18 6.783 19,901 (38) 59 5 (84) (100) (100) (91) (33) 289 552 4,075 423 59 193 (389) 263 (321) (37) (476) 174 279 (311) (9) 1,529 8 2,506 4,277 6.783 (36.16) 37.00 50.00 166.38 (134.78) 703.21 7.87 58.59 437 (227) (6) 574 (23) 312 3,965 4,277 (100) 94 207 562 1,088 125.70 (100.00) 249 94 444 $ 115 (2) 113 455 $ 54 19.42 54.29 381 $ 35 Income Statement - USD ($) shares in Millions, $ in Millions Dec 31, 2020 12 Months Ended Chang (Dec 31, 2019 Change Dec 31, 2018 $1,052 27.236 2.306 31,536 21 31 4 28 5869 20.821 2.226 24,578 (2) 12 60 15 5883 18515 1.391 21.461 563 20.259 2.671 24,906 6,630 23 24 (4) 21 459 16,398 2,770 20,509 4.069 (6) 16 47 18 1 488 14,174 1,880 17,419 4,042 1.491 3.145 Revenues Automotive leasing Total automotive revenues Services and other Tost revenues Cost ofrey emes Automotive leasing Toal automotive cost of revenues Services and other Total cost of revenues Gross profit Operating expenses Research and development Selling eneral and administrative Restructuring and other Total operating expenses Income (los) from operations Invest income Interestexpense Other (expense) income.net Income (los) before income taxes Provision for income taxes Net home (los) Net icone (los) attrbutable to moncontrotting interests and a deemabe noncontroling interests in subsidiaries Net income (loss) attrbutable to common stockhobers Less Bur out of non controlling interest Net income (los) used in computing net income (bs) per share a common stock Net income (loss) per share of common stock attributable to common stockholders 11 19 (100) 12 (2.990) (32) 9 (371) (274) 165 (211) 62 4,636 1.994 30 748) 122 1,154 292 862 141 1,343 2,646 149 4,138 (69) 44 (585) 45 (665) 110 0975) 87 cara 64-669cm 868 a (8) (0) 10 (7) (82 83 3 105 34 90 1.460 2,835 135 4.430 (388) 24 (663) 22 (1,005) 5 (1,063) (87) (200) (12) (976) 721 31 $ 690 (184) 288 (179) (862) 8 S (870) (11) $(976 $0.74 30.64 (176) (165) $(0.98) S(0.98) (14) (14) $(1.14 $(1.14 933 1,083 5 5 22 887 887 4 4 853 853 Basic 11 Diluted 11 Weighted average shares used in computing net in cme (loss) per share of common stock Basic 11 Diluted 11 Automotive Sales Member Revenues Revenues Cost ofreremes Cost of revenues Energy Generation and Stora Member Rerences Revenues Cost of reve mes Cost of revenues $ 26,184 31 $ 19,952 13 $ 17,632 19,696 24 15,939 16 13,686 1,994 30 1,531 (2) 1.555 $1.976 47 $ 1.341 (2) $ 1.365 111 Prior period resuts have been adjusted to reflect the five-for-one stock split efected in the form of a stock dividend in Auzust 2020. See Noel
Step by Step Solution
There are 3 Steps involved in it

Get step-by-step solutions from verified subject matter experts