Question: case studyRed Brand Canner and Its Supply Chain. What do you think about the current pricing scheme? PLEASE use excel to consider different situations and
case studyRed Brand Canner and Its Supply Chain.
What do you think about the current pricing scheme? PLEASE use excel to consider different situations and you can use excel solver for optimization.
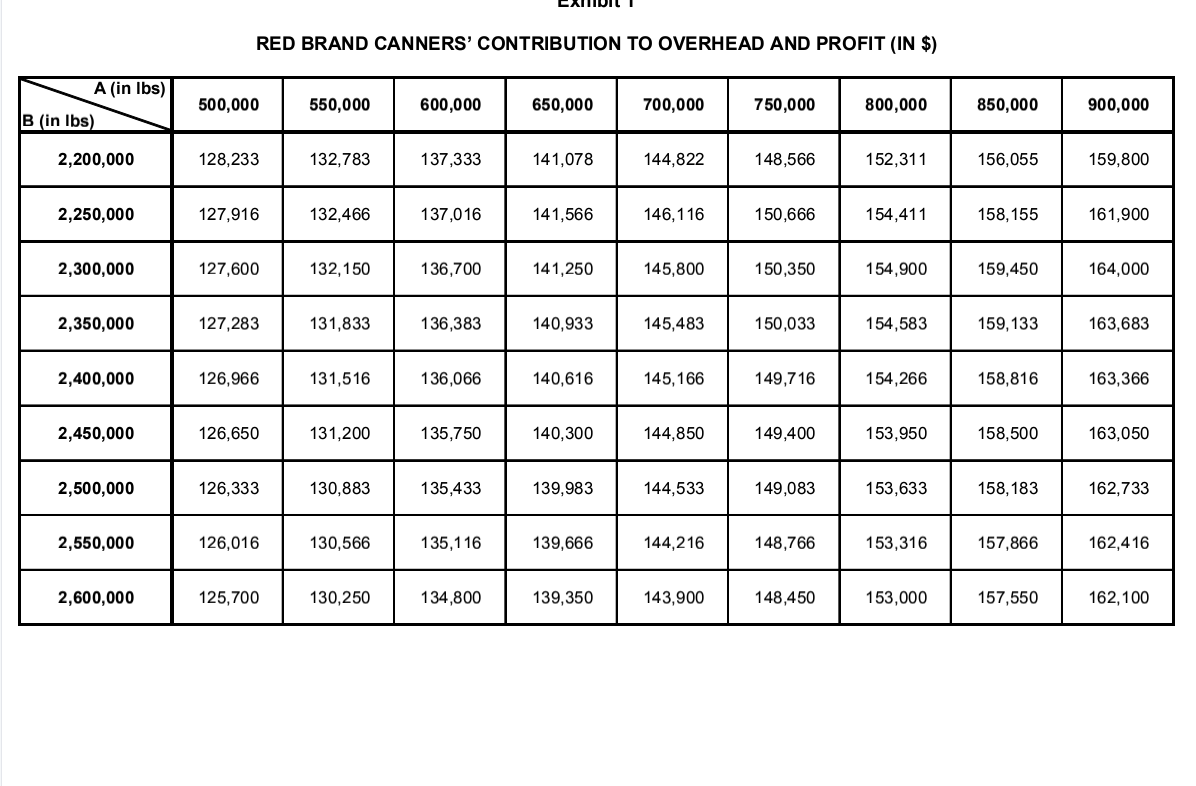
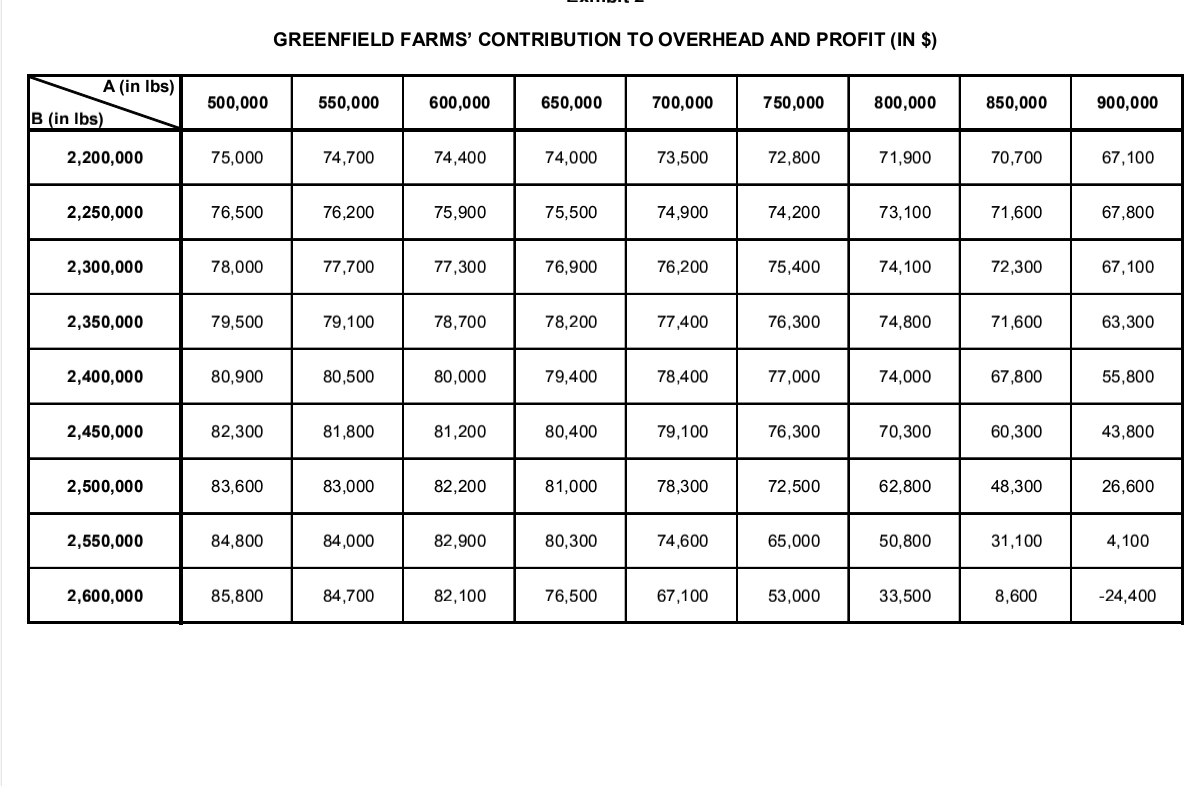
Mitchell Gordon, vice-president of operations at Red Brand Canners (RBC), was pleased. The discussion at the recent meeting regarding the allocation of this year's tomato crop to the firm's three end products turned out to be very successful. The analysis carried out by a young MBA student shed new light on the production allocation problem. The student was hired for the summer from a nearby business school and had derived his recommendation of how to use the 3,000,000 pounds of tomatoes on the basis of a mathematical optimization approach. The performance results would amount to $676,066 and represent projected revenues minus all variable operating costs except the fruit cost. Deducting the total tomato cost at 18 per pound (including delivery) produced a contribution of $136,066 to overhead and profit, a figure substantially higher than what was presented in the proposals made by his colleagues Cooper and Myers. Furthermore, the allocation proposed by the student suggested that the entire harvest would be used rather than a large amount of Grade B tomatoes being left over as a consequence of Cooper's recommendation. Thus, Gordon could look forward to a better profit performance than in previous years, in particular if the same kind of reasoning was also applied to peaches, apples and other produce. Nevertheless, Gordon was very concerned about the high proportion of Grade B tomatoes that the supplier, Greenfield Farms (GF), had delivered. Although the end products paste and juice could be made by using entirely or primarily B quality tomatoes, the market potential of these products was rather limited. The sales forecast for whole tomatoes requiring mostly A quality tomatoes , however, was almost unlimited. Gordon realized that a harvest with a higher proportion of Grade A quality tomatoes was important to RBC to generate more revenues and thus improve the financial performance. The mix and volume of the tomatoes harvested were under the control of GF's management, although weather conditions also played an important role. The current delivery contract between both firms agreed upon at the time of planting - specified an average delivered price of 18 per pound regardless of quality and quantity. Gordon felt that maintaining the commitment of accepting GF's entire output a condition typical in the agricultural business was an essential part of the contract and could not easily be dropped. However, this feature and the unit price per pound did not act as incentives to increase quality. Therefore, Gordon was wondering if modifying parts of the delivery arrangement might motivate GF to produce a tomato crop more in line with RBC's needs. Before approaching the management at GF with this issue, Gordon wanted to explore the impact other quality and quantity mixes and changes in the pricing would have on RBC's performance. As a first step, he asked the MBA student to determine the firm's performance for different quality and quantity combinations of the tomato crop. Exhibit 1 summarizes the maximum revenues minus all variable operating costs, including the fruit cost, at the current level of 18 per pound. Since RBC was a price taker in the B-to-C section of the supply chain, Gordon suggested that for the purpose of this analysis the retail prices for the firm's end products should remain unchanged. The results in Exhibit 1 were derived for those quality and quantity scenarios representing the range of actual harvests in previous years, again using the new optimization approach. Exhibit 1 indicated that RBC's preferred region was in the right-hand section, significantly far away from the current harvest. Although the figures confirmed Gordon's hypothesis that more Grade A tomatoes would improve the financial results, he was somewhat surprised that larger amounts of B quality tomatoes could also be beneficial, although to a lesser extent and only if in combination with a sufficiently large amount of A quality tomatoes. Therefore, the challenge was to modify the delivery contract such that GF would agree to produce a harvest in or near RBC's preferred region. It seemed logical to Gordon that GF would do so only if such a change carried the potential of improving its own performance. The insights obtained from these exercises made it clear to Gordon that the management of GF had to be involved. So he invited Jack Watson, the controller at GF, for lunch to discuss the issue. After some general words on their business relations, Gordon raised his concern about the quality and quantity mix of this year's tomato harvest. He explained to Watson, The market conditions for RBC's end products require a higher proportion of Grade A tomatoes. Only a last minute change in this year's allocation of the tomato crop has avoided a situation in which the firm would have been left with some 200,000 pounds of unprocessed Grade B tomatoes. While simply more Grade A tomatoes would be best, Gordon indicated to Watson that he would be prepared to consider also an increased amount of Grade B tomatoes as long as it was matched by a sufficiently larger amount of A quality tomatoes. " Watson said, Although I understand your concern, I am not sure what the implications would be for us at GF. Moving into the region you prefer means that we would have to incur higher cost of production, which would cut into our profit unless accompanied by a higher unit price. To be sure, I have to determine first the consequences other quality and quantity combinations will have on our performance.' I agree with you, Gordon interrupted, and I suggest you apply the same format we have used. After being handed RBC's working sheet (without the numerical performance results), Watson replied, I will go through this exercise, but my colleagues at GF are known to be reluctant to change. However, if nothing else will, the numbers can convince them. After paying the lunch bill, Watson insisted, If this turns out to be a win-win situation, we have to share the incremental profits in equal parts. Given the good business relations between our firms, I am sure we will reach an agreement about that, Gordon replied and went to his car. Back at his office, Watson began to dig into the firm's cost records in order to get an idea of how the cost of growing tomatoes could be estimated. Besides the fixed cost of about $30,000 for preparing the fields dedicated to the growing of tomatoes, the production cost consisted of the cost for seedlings, fertilizer, pesticides, watering and cultivating, which varied with the output intended. An increase in the total volume and/or in the quantity of Grade A tomatoes could be accomplished by purchasing better quality plants at higher cost. Finally, there was the labour-intensive cost of harvesting, sorting and transportation, which amounted to 7.5 per pound. While it should be relatively easy to identify the various cost components, Watson realized that it would be more difficult to estimate the cost of different levels of output precisely. Nevertheless, he felt that with the available cost figures from the past he would be able to calculate the cost reasonably well for some quality and quantity combinations and at least to "come close" for others. The figures in Exhibit 2 summarize GF's contribution to overhead and profit at the current price of 18 per pound. After reflecting on these figures, Watson was surprised. As expected, the contribution figures indicated that a tomato harvest with fewer A quality and significantly more B quality tomatoes (i.e., the lower left corner in his exhibit) would be most profitable to his firm. He realized that the diverging interests could lead to serious tensions between both firms, a situation he was eager to avoid. However, he also noticed that some existing combinations with more Grade A tomatoes would enhance GF's financial performance relative to the status quo. Depending on the attractiveness of these combinations to RBC, a win-win situation might therefore be possible. On another dimension, Watson was reminded that due to weather conditions the actual output in mix and volume could vary from what was intended at the time of planting. While such deviations would manifest themselves immediately in the sales revenues obtained, they would only impact the cost of harvesting, sorting and transportation. After double checking his calculations, Watson contacted Gordon to arrange another meeting. The exercise you suggested turned out to be really interesting, Watson opened the discussion, but based on my calculations a harvest with a much higher proportion of Grade A tomatoes would only be possible at a hike in the unit price per pound. I did not have the time to determine at what level GF could deliver and still make enough profits. On the other hand, with a small increase in the unit price, we would be prepared to grow 650,000 pounds of A quality tomatoes as long as the volume of B tomatoes can rise to 2,500,000 pounds. Visibly disappointed by Watson's reluctance to move much closer to RBC's preferred region, Gordon replied, We at RBC must insist on a high proportion of Grade A tomatoes. Remember that we carry the consequences of a poor harvest if Mother Nature does not cooperate. I am beginning to think that the current pricing system may not be suited for realising our requirements and at the same time assuring that both of us are ahead of the game. A new and creative approach to pricing might help. Why don't we both try to think about it? CADILI RED BRAND CANNERS' CONTRIBUTION TO OVERHEAD AND PROFIT (IN $) A (in lbs) B (in Ibs) 500,000 550,000 600,000 650,000 700,000 750,000 800,000 850,000 900,000 2,200,000 128,233 132,783 137,333 141,078 144,822 148,566 152,311 156,055 159,800 2,250,000 127,916 132,466 137,016 141,566 146,116 150,666 154,411 158, 155 161,900 2,300,000 127,600 132,150 136,700 141,250 145,800 150,350 154,900 159,450 164,000 2,350,000 127,283 131,833 136,383 140,933 145,483 150,033 154,583 159,133 163,683 2,400,000 126,966 131,516 136,066 140,616 145, 166 149,716 154,266 158,816 163,366 2,450,000 126,650 131,200 135,750 140,300 144,850 149,400 153,950 158,500 163,050 2,500,000 126,333 130,883 135,433 139,983 144,533 149,083 153,633 158, 183 162,733 2,550,000 126,016 130,566 135,116 139,666 144,216 148,766 153,316 157,866 162,416 2,600,000 125,700 130,250 134,800 139,350 143,900 148,450 153,000 157,550 162, 100 GREENFIELD FARMS' CONTRIBUTION TO OVERHEAD AND PROFIT (IN $) A (in lbs) 500,000 550,000 600,000 650,000 700,000 750,000 800,000 850,000 900,000 B (in lbs) 2,200,000 75,000 74,700 74,400 74,000 73,500 72,800 71,900 70,700 67,100 2,250,000 76,500 76,200 75,900 75,500 74,900 74,200 73,100 71,600 67,800 2,300,000 78,000 77,700 77,300 76,900 76,200 75,400 74,100 72,300 67,100 2,350,000 79,500 79,100 78,700 78,200 77,400 76,300 74,800 71,600 63,300 2,400,000 80,900 80,500 80,000 79,400 78,400 77,000 74,000 67,800 55,800 2,450,000 82,300 81,800 81,200 80,400 79,100 76,300 70,300 60,300 43,800 2,500,000 83,600 83,000 82,200 81,000 78,300 72,500 62,800 48,300 26,600 2,550,000 84,800 84,000 82,900 80,300 74,600 65,000 50,800 31,100 4,100 2,600,000 85,800 84,700 82,100 76,500 67,100 53,000 33,500 8,600 -24,400


