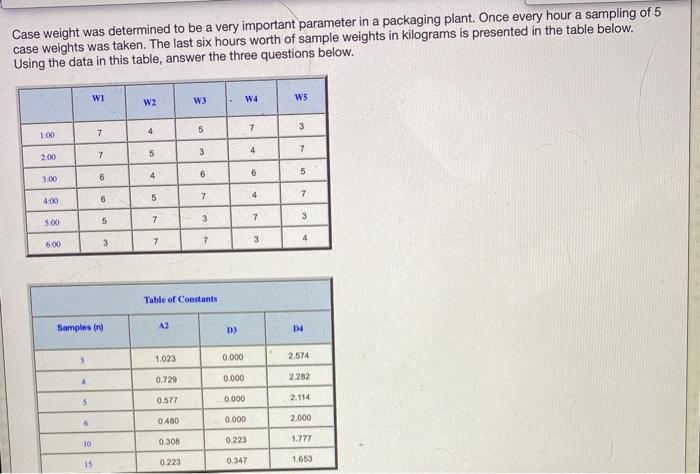
Question: Case weight was determined to be a very important parameter in a packaging plant. Once every hour a sampling of 5 case weights was taken.

Case weight was determined to be a very important
Case weight was determined to be a very important parameter in a packaging plant. Once every hour a sampling of 5 case weights was taken. The last six hours worth of sample weights in kilograms is presented in the table below. Using the data in this table, answer the three questions below. WI W3 W4 W2 WS 4 5 7 3 7 100 3 4 7 2.00 7 5 6 6 5 6 3:00 4 4 7 4:00 7 6 5 5 7 3 7 5.00 3 600 3 7 3 7 Table of Constants Samples in A2 D3 14 1.023 0.000 2.574 0.729 4 2282 0.000 0.577 0.000 2.114 0.480 6 2.000 0.000 10 0.305 0.223 1.777 15 0.223 0.347 1.653 Question Completion Status: New Set of Simple Meant und Range 43 59 5.8 60 10 32 6.1 34 What is overall process avg. of these weights? A. Overall Process Avg. = 5.13 What is the avg. range of these weights? B. X-bar UCL = 6.96; X-bar LCL = 3.3 What are the upper and lower control limits of the X-bar chart for this set of data? What are the upper and lower control limits of the R-chart for this set of data? C. Yes, all means and ranges are within the control limits. Given the new set of sample means and ranges in the above table. Is this process in control? Why? D. R-chart UCL = 5.98; R-chart LCL = 0 E. Avg. Range = 3 F. Overall Process Avg. = 5,23 G. The correct answer is not on the list. H. X-bar UCL-7.15; X-bar LCL = 3.11 1. No, above the UCL of the X-bar chart J. No, above the UCL of the R chart K R-chart UCL - 7.4; R-chart LCL-0 L. X-bar UCL 7.06; X-bar LCL = 3.8 M.R-chart UCL = 6.34;R-chart LCL = 0 N. Avg. Range - 2.83 Press A5.57 J. No, above the UCL of the R chart K. R-chart UCL = 7.4; R-chart LCL = 0 L. X-bar UCL = 7.06; X-bar LCL = 3.8 M.R-chart UCL = 6.34; R-chart LCL = 0 N. Avg. Range = 2.83 o. Overall Process Avg. = 5757 P. X-bar UCL = 7.25; X-bar LCL = 3.21 Q. R-chart UCL = 6.7; R-chart LCL = 0 R. Overall Process Avg. = 5.43 S. Avg. Range = 3.5 T. Avg. Range = 3.17

Step by Step Solution

There are 3 Steps involved in it

1 Expert Approved Answer
Step: 1 Unlock blur-text-image
Question Has Been Solved by an Expert!

Get step-by-step solutions from verified subject matter experts

Step: 2 Unlock
Step: 3 Unlock

Students Have Also Explored These Related General Management Questions!