

Question: Cell referencing please module Data Review View Help Te Formulas Home Insert Draw Page Layout Queries & Connections n From Text/CSV O Recent Sources Fiom
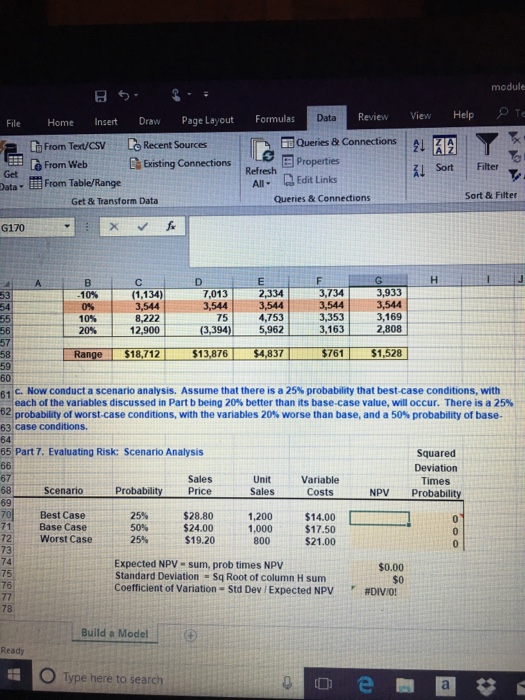
module Data Review View Help Te Formulas Home Insert Draw Page Layout Queries & Connections n From Text/CSV O Recent Sources Fiom Webig Properties All Edit Links E Existing Connections Refresh l Sort Filter ata. l From Table/Range Sort & Filter Get & Transform Data Queries & Connections G170 3,734 3,544 3,353 3,163 7,013 2,334 3,933 (1,134) 3,544 8,222 12,900 10% 3,544 3,544 4,753 3,169 2,808 10% 75 56 (3,394) 5,962 Range $18,71213876$4,837761 $1,528 59 60 C. Now conduct a scenario analysis. Assume that there is a 25% probability that best-case conditions, with each of the variables discussed in Part b being 20% better than its base-case value, will occur. There is a 25% 621 probability of worst-case conditions, with the variables 20% worse than base, and a 50% probability of base- 63 case conditions. 65 Part 7. Evaluating Risk: Scenario Analysis Squared Deviation Times Sales Unit Variable Sales Costs NPV Probability Scenario 70Best Case 71 Base Case 72 73 25% $28.80 1,200 $14.00 $17.50 800$21.00 50% $24.00 19.20 1,000 Worst Case Expected NPV sum, prob times NPV Standard Deviation Sq Root of column H sum coefficient of variation-Std Dev i Expected NpV $0.00 $0 75 r #DIV/0! Build a Model O Type here to search
Step by Step Solution
There are 3 Steps involved in it

Get step-by-step solutions from verified subject matter experts