

Question: Ceramic Structures has experienced rapid growth over the past several years. Sales are expected to grow at 15% per year for the next three years.
Ceramic Structures has experienced rapid growth over the past several years. Sales are expected to grow at 15% per year for the next three years. Sales growth has been fueled by aggressive pricing as well as increased use of ceramics in high performance engines.
Asset growth has been financed by internal funds as well as the increased use of debt. At the end of 2018, the debt was restructured with a new 10% seven-year loan with principal payments of $1 million per year. In addition a $1.5 million working capital line was negotiated in 2017. It was increased to $2.5 million in 2019 and $3.5 million in 2020. Interest is charged at prime + 1%. (For class, we will use 9%.) Cash balances will be kept around $250,000 and the credit line will average $2 million. PLEASE SHOW ALL WORK AND FORMULAS!
1a. Prepare pro-forma statements for Ceramic and determine their need for funds for the years 2021-2023.
1b. Why is there a need for funds when Ceramic is generating a profit?
1c. If expected sales growth fell to 8% per year, what would be Ceramics need for funds?
1d. What would happen to Ceramics need for funds if accounts receivable increased to 25% of sales?
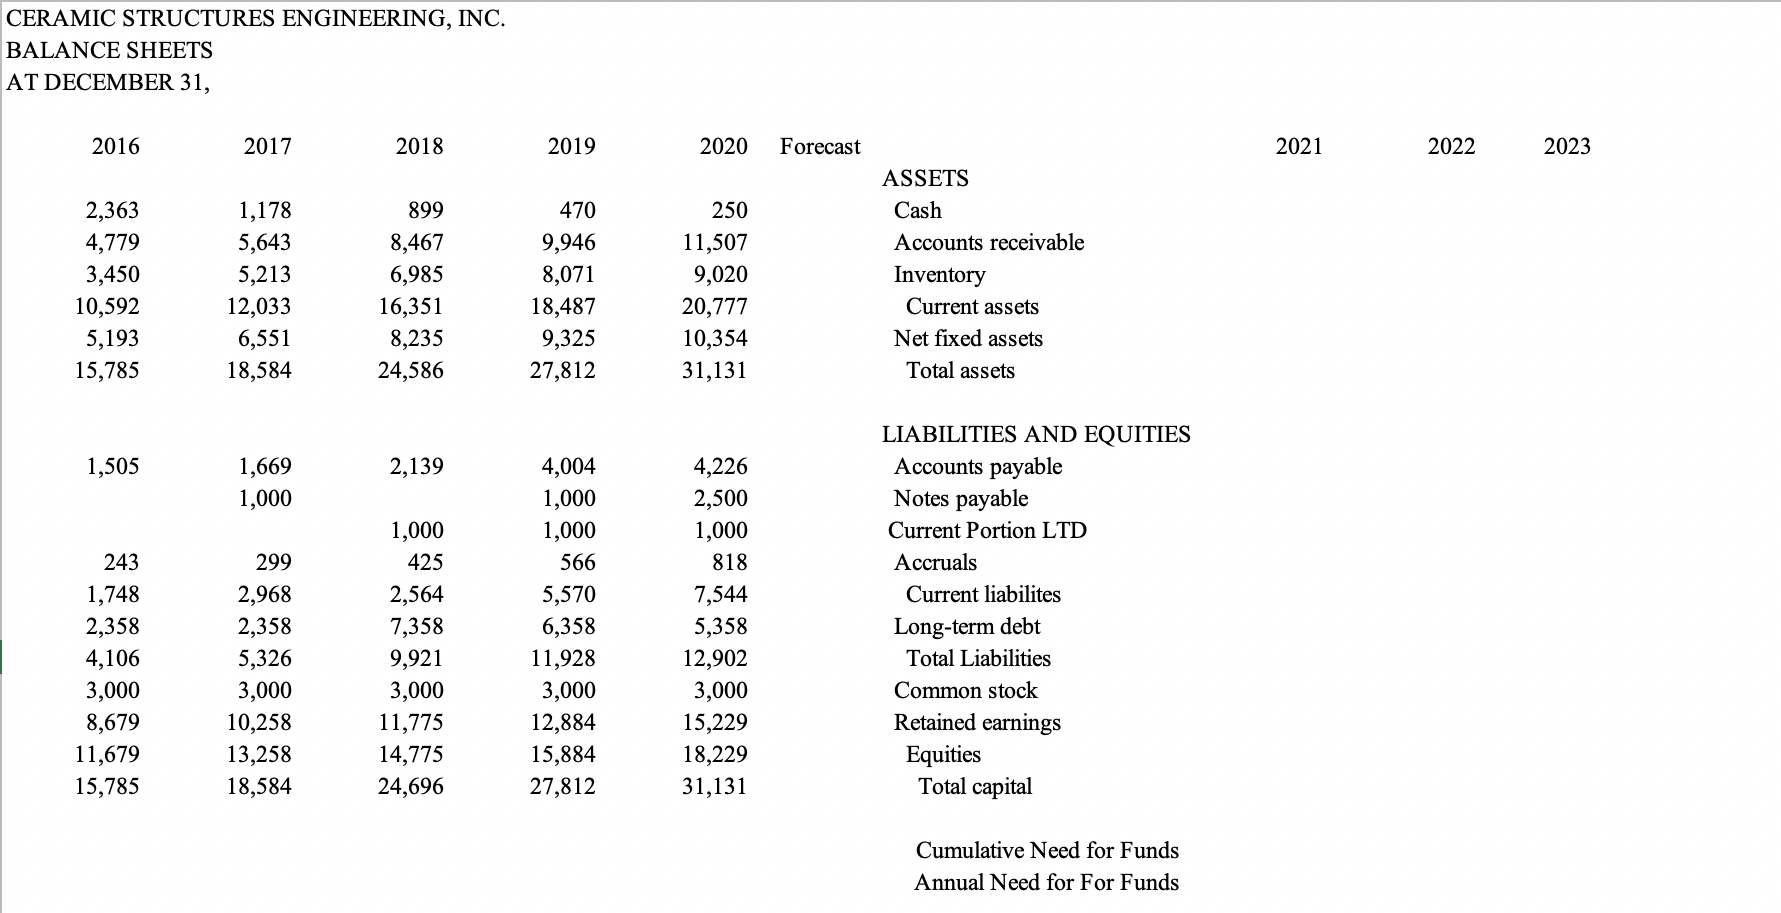
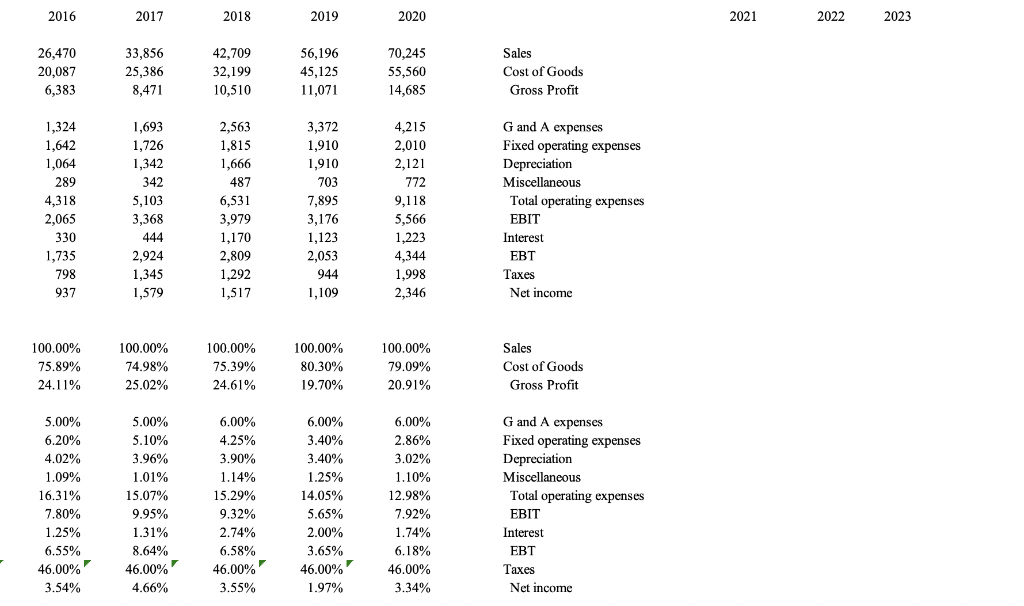
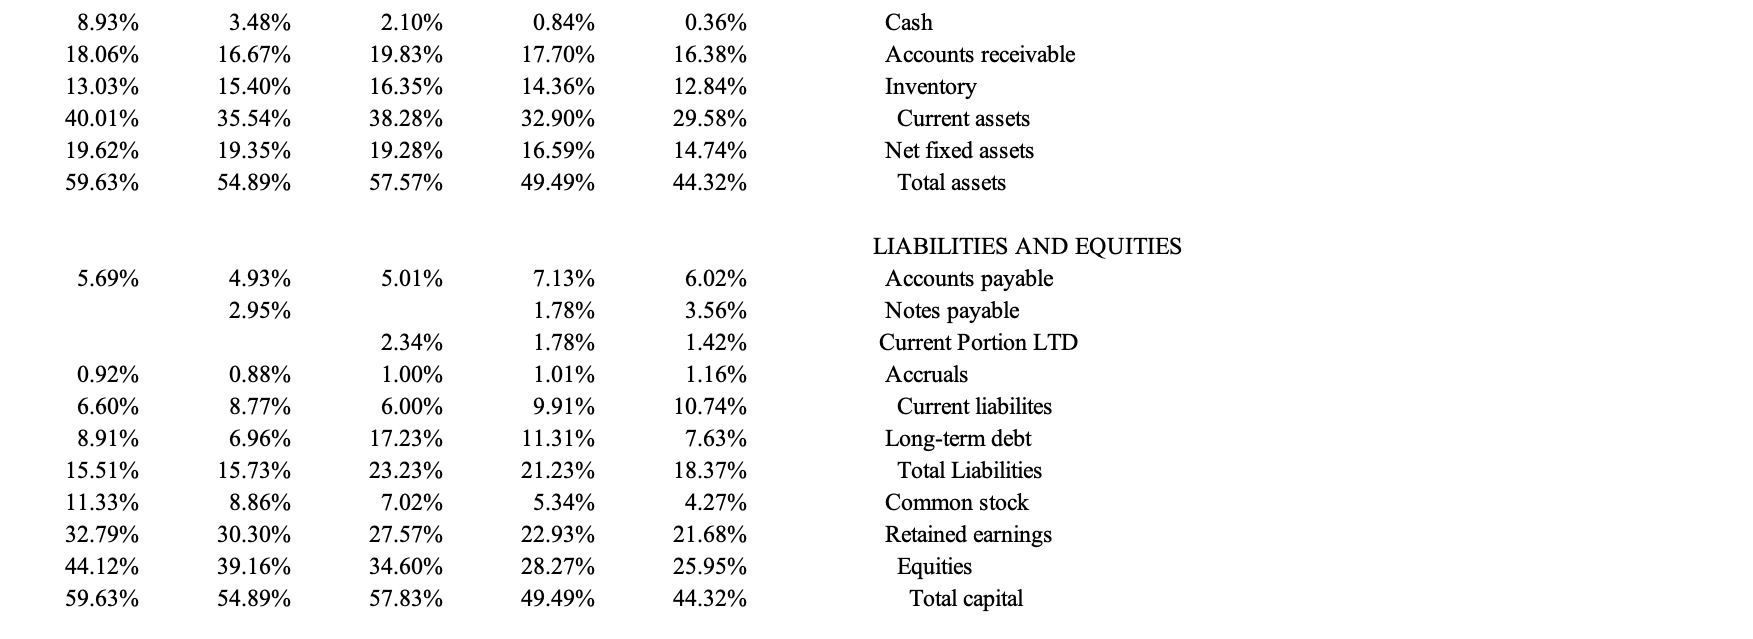
CERAMIC STRUCTURES ENGINEERING, INC. BALANCE SHEETS AT DECEMBER 31, 2016 2017 2018 2019 2020 Forecast 2021 2022 2023 ASSETS 899 470 250 Cash Accounts receivable 2,363 4,779 3,450 10,592 5,193 15,785 1,178 5,643 5,213 12,033 6,551 18,584 8,467 6,985 16,351 8,235 24,586 9,946 8,071 18,487 9,325 27,812 11,507 9,020 20,777 10,354 31,131 Inventory Current assets Net fixed assets Total assets 1,505 2,139 1,669 1,000 4,004 1,000 1,000 LIABILITIES AND EQUITIES Accounts payable Notes payable Current Portion LTD 243 299 566 Accruals Current liabilites Long-term debt 1,748 2,358 4,106 3,000 8,679 11,679 15,785 1,000 425 2,564 7,358 9,921 3,000 11,775 14,775 24,696 2,968 2,358 5,326 3,000 10,258 13,258 18,584 Total Liabilities 4,226 2,500 1,000 818 7,544 5,358 12,902 3,000 15,229 18,229 31,131 5,570 6,358 11,928 3,000 12,884 15,884 27,812 Common stock Retained earnings Equities Total capital Cumulative Need for Funds Annual Need for For Funds 2016 2017 2018 2019 2020 2021 2022 2023 Sales 26,470 20,087 6,383 33,856 25,386 8,471 42,709 32,199 10,510 56,196 45,125 11,071 70,245 55,560 14,685 Cost of Goods Gross Profit 1,324 1,642 1,064 2,563 1,815 1,693 1,726 1,342 342 5,103 3,368 444 4,215 2,010 2,121 772 1,666 487 3,372 1,910 1,910 703 7,895 3,176 1,123 289 4,318 2,065 330 1,735 798 G and A expenses Fixed operating expenses Depreciation Miscellaneous Total operating expenses EBIT 6,531 3,979 1,170 Interest 9,118 5,566 1,223 4,344 1,998 2,346 2,924 2,809 2,053 EBT 944 1,345 1,579 1,292 1,517 Taxes Net income 937 1,109 100.00% 100.00% 100.00% 100.00% 100.00% 75.39% Sales Cost of Goods 75.89% 74.98% 80.30% 79.09% 24.11% 25.02% 24.61% 19.70% 20.91% Gross Profit 5.00% 5.00% 6.00% 6.00% 6.20% 5.10% 2.86% 3.40% 3.40% 4.02% 3.96% 3.02% G and A expenses Fixed operating expenses Depreciation Miscellaneous Total operating expenses EBIT 1.01% 1.25% 1.10% 1.09% 16.31% 6.00% 4.25% 3.90% 1.14% 15.29% 9.32% 2.74% 6.58% 46.00% 3.55% 15.07% 9.95% 7.80% 1.25% 14.05% 5.65% 2.00% 12.98% 7.92% 1.74% 6.18% 1.31% Interest EBT 6.55% 46.00% 3.54% 8.64% 46.00% 4.66% 3.65% 46.00%' 46.00% Taxes 1.97% 3.34% Net income 8.93% 3.48% 2.10% 0.84% 0.36% Cash 18.06% 16.67% 19.83% 17.70% 16.38% 13.03% 15.40% 16.35% 12.84% 14.36% 32.90% 40.01% 35.54% 38.28% 29.58% Accounts receivable Inventory Current assets Net fixed assets Total assets 19.62% 19.35% 19.28% 16.59% 14.74% 59.63% 54.89% 57.57% 49.49% 44.32% 5.69% 4.93% 5.01% 7.13% LIABILITIES AND EQUITIES Accounts payable Notes payable Current Portion LTD 2.95% 6.02% 3.56% 1.42% 1.16% 1.78% 1.78% 2.34% 0.92% 0.88% 1.00% 1.01% Accruals 6.60% 8.77% 6.00% 9.91% 10.74% Current liabilites 8.91% 6.96% 17.23% 7.63% 11.31% 21.23% Long-term debt Total Liabilities 15.51% 15.73% 23.23% 18.37% 11.33% 8.86% 7.02% 5.34% 4.27% Common stock 32.79% 30.30% 27.57% 22.93% 21.68% 44.12% 39.16% 34.60% 28.27% 25.95% Retained earnings Equities Total capital 59.63% 54.89% 57.83% 49.49% 44.32% CERAMIC STRUCTURES ENGINEERING, INC. BALANCE SHEETS AT DECEMBER 31, 2016 2017 2018 2019 2020 Forecast 2021 2022 2023 ASSETS 899 470 250 Cash Accounts receivable 2,363 4,779 3,450 10,592 5,193 15,785 1,178 5,643 5,213 12,033 6,551 18,584 8,467 6,985 16,351 8,235 24,586 9,946 8,071 18,487 9,325 27,812 11,507 9,020 20,777 10,354 31,131 Inventory Current assets Net fixed assets Total assets 1,505 2,139 1,669 1,000 4,004 1,000 1,000 LIABILITIES AND EQUITIES Accounts payable Notes payable Current Portion LTD 243 299 566 Accruals Current liabilites Long-term debt 1,748 2,358 4,106 3,000 8,679 11,679 15,785 1,000 425 2,564 7,358 9,921 3,000 11,775 14,775 24,696 2,968 2,358 5,326 3,000 10,258 13,258 18,584 Total Liabilities 4,226 2,500 1,000 818 7,544 5,358 12,902 3,000 15,229 18,229 31,131 5,570 6,358 11,928 3,000 12,884 15,884 27,812 Common stock Retained earnings Equities Total capital Cumulative Need for Funds Annual Need for For Funds 2016 2017 2018 2019 2020 2021 2022 2023 Sales 26,470 20,087 6,383 33,856 25,386 8,471 42,709 32,199 10,510 56,196 45,125 11,071 70,245 55,560 14,685 Cost of Goods Gross Profit 1,324 1,642 1,064 2,563 1,815 1,693 1,726 1,342 342 5,103 3,368 444 4,215 2,010 2,121 772 1,666 487 3,372 1,910 1,910 703 7,895 3,176 1,123 289 4,318 2,065 330 1,735 798 G and A expenses Fixed operating expenses Depreciation Miscellaneous Total operating expenses EBIT 6,531 3,979 1,170 Interest 9,118 5,566 1,223 4,344 1,998 2,346 2,924 2,809 2,053 EBT 944 1,345 1,579 1,292 1,517 Taxes Net income 937 1,109 100.00% 100.00% 100.00% 100.00% 100.00% 75.39% Sales Cost of Goods 75.89% 74.98% 80.30% 79.09% 24.11% 25.02% 24.61% 19.70% 20.91% Gross Profit 5.00% 5.00% 6.00% 6.00% 6.20% 5.10% 2.86% 3.40% 3.40% 4.02% 3.96% 3.02% G and A expenses Fixed operating expenses Depreciation Miscellaneous Total operating expenses EBIT 1.01% 1.25% 1.10% 1.09% 16.31% 6.00% 4.25% 3.90% 1.14% 15.29% 9.32% 2.74% 6.58% 46.00% 3.55% 15.07% 9.95% 7.80% 1.25% 14.05% 5.65% 2.00% 12.98% 7.92% 1.74% 6.18% 1.31% Interest EBT 6.55% 46.00% 3.54% 8.64% 46.00% 4.66% 3.65% 46.00%' 46.00% Taxes 1.97% 3.34% Net income 8.93% 3.48% 2.10% 0.84% 0.36% Cash 18.06% 16.67% 19.83% 17.70% 16.38% 13.03% 15.40% 16.35% 12.84% 14.36% 32.90% 40.01% 35.54% 38.28% 29.58% Accounts receivable Inventory Current assets Net fixed assets Total assets 19.62% 19.35% 19.28% 16.59% 14.74% 59.63% 54.89% 57.57% 49.49% 44.32% 5.69% 4.93% 5.01% 7.13% LIABILITIES AND EQUITIES Accounts payable Notes payable Current Portion LTD 2.95% 6.02% 3.56% 1.42% 1.16% 1.78% 1.78% 2.34% 0.92% 0.88% 1.00% 1.01% Accruals 6.60% 8.77% 6.00% 9.91% 10.74% Current liabilites 8.91% 6.96% 17.23% 7.63% 11.31% 21.23% Long-term debt Total Liabilities 15.51% 15.73% 23.23% 18.37% 11.33% 8.86% 7.02% 5.34% 4.27% Common stock 32.79% 30.30% 27.57% 22.93% 21.68% 44.12% 39.16% 34.60% 28.27% 25.95% Retained earnings Equities Total capital 59.63% 54.89% 57.83% 49.49% 44.32%
Step by Step Solution
There are 3 Steps involved in it

Get step-by-step solutions from verified subject matter experts