

Question: Ch 05- Exploring Finance Visualizations - Compounding The blue curve depicts the change in the future value of $1 with compound interest. Move the slider
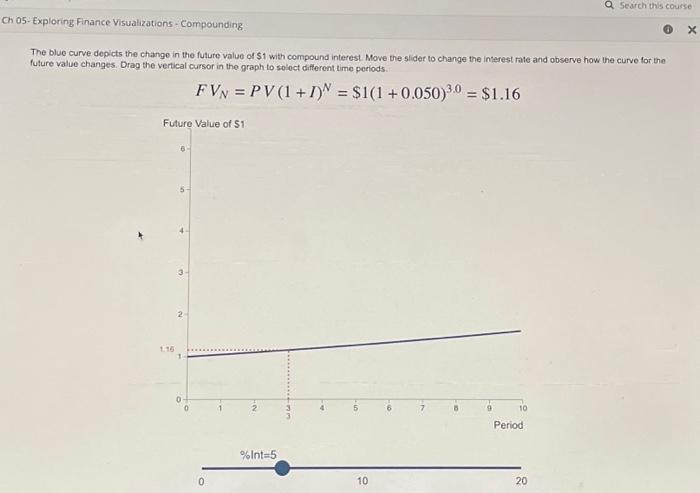
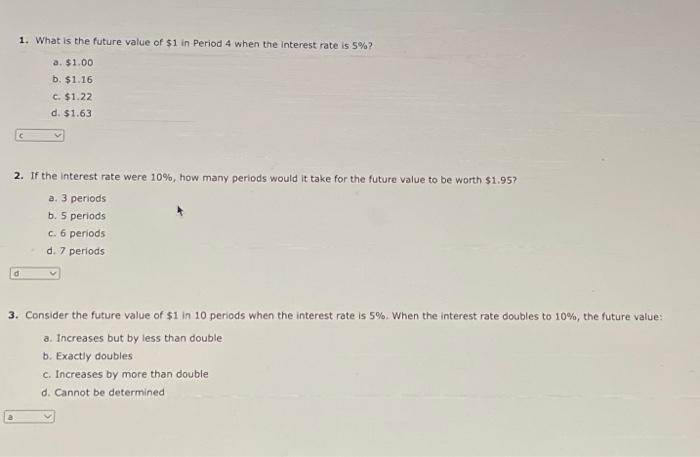
The blue curve depicts the change in the future value of $1 with compound interest. Move the slider to change the interest rate and observe how the curve for the future value changes. Drag the vertical cursor in the graph to solect different time periods FVN=PV(1+I)N=$1(1+0.050)3.0=$1.16 1. What is the future value of $1 in Period 4 when the interest rate is 5% ? a. $1,00 b. $1.16 c. $1.22 d. $1.63 2. If the interest rate were 10%, how many periods would it take for the future value to be worth $1.95 ? a. 3 periods b. 5 periods c. 6 periods d. 7 periods 3. Consider the future value of $1 in 10 periods when the interest rate is 5%. When the interest rate doubles to 10%, the future value: a. Increases but by less than double b. Exactly doubles c. Increases by more than double d. Cannot be determined
Step by Step Solution
There are 3 Steps involved in it

Get step-by-step solutions from verified subject matter experts