

Question: Ch 06: Assignment - Interest Rates The following graph shows the supply of and demand for capital in a market over the last year. You
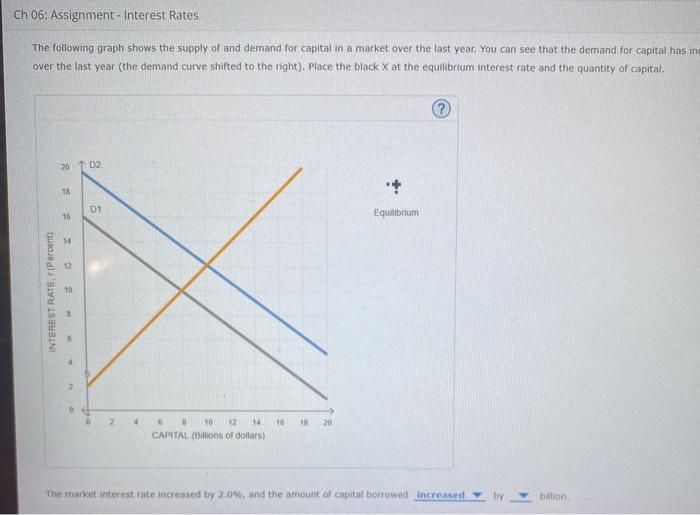
Ch 06: Assignment - Interest Rates The following graph shows the supply of and demand for capital in a market over the last year. You can see that the demand for capital has in over the last year (the demand curve shifted to the right). Place the black X at the equilibrium interest rate and the quantity of capital. ? 2002 + 18 D1 Equilibrium 16 14 INTEREST RATE. (Percent) 10 18 20 3 10 12 14 CAPITAL ( Bons of dollars) The market interest rate increased by 2.09, and the amount of capital borrowed increased bilion The market interest rate increased by 2.0%, and the amount of capital borrowed increased by billion. Does it appear that the economy has strengthened or weakened over the past year? Weakened Strengthened Grade It Now Save
Step by Step Solution
There are 3 Steps involved in it

Get step-by-step solutions from verified subject matter experts