

Question: Ch 07 - Excel Online Structured Activity. Bond Valuation Question 1 0/10 Excel Online Structured Activity: Bond Valuation Submit Clifford Clark is a recent retiree
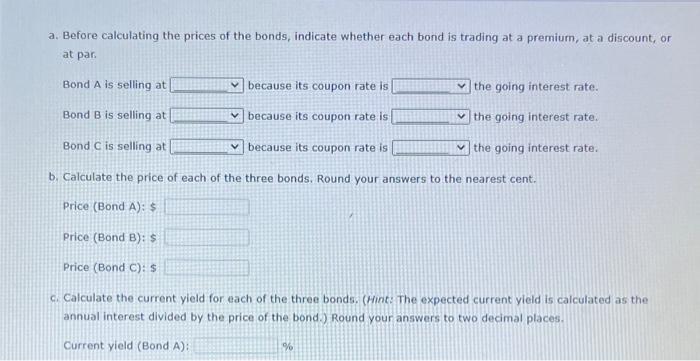
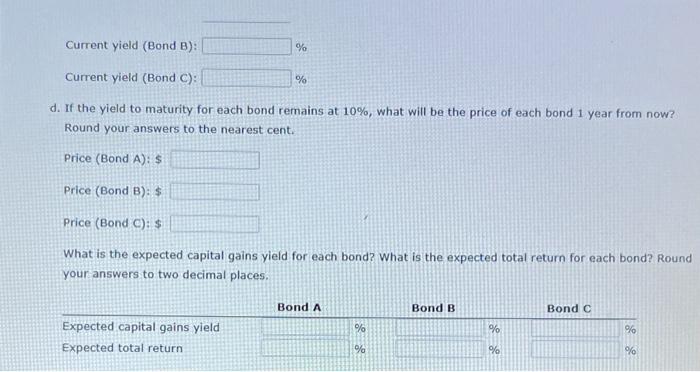
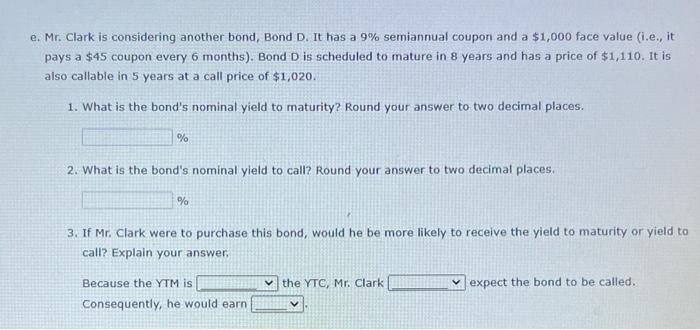
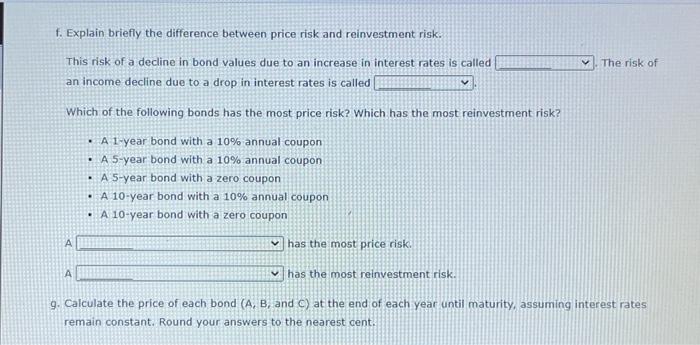
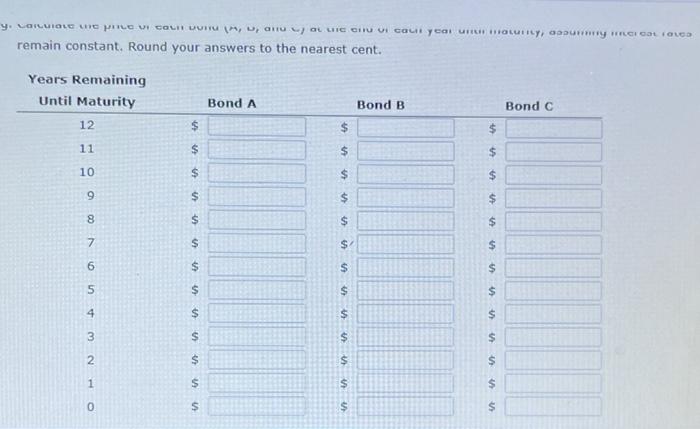
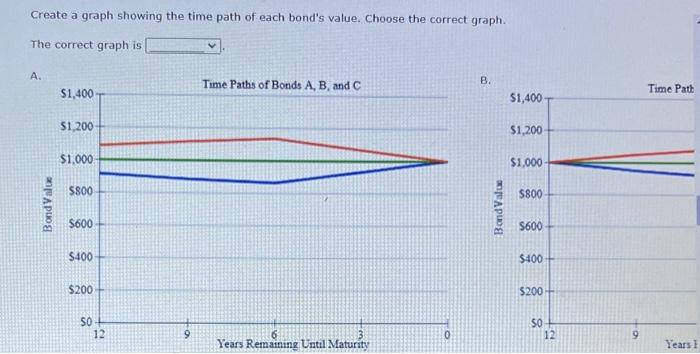
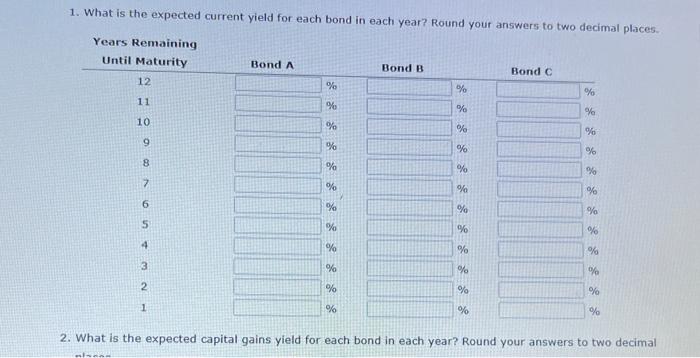
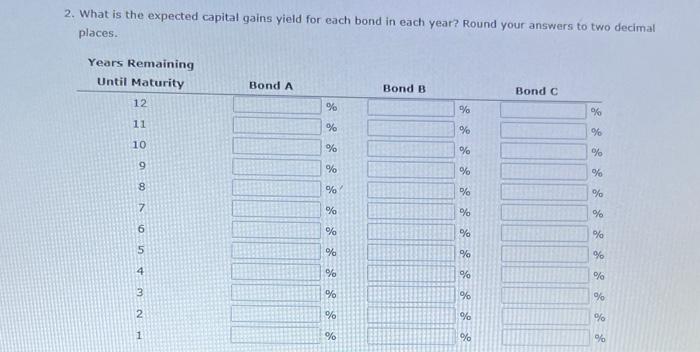
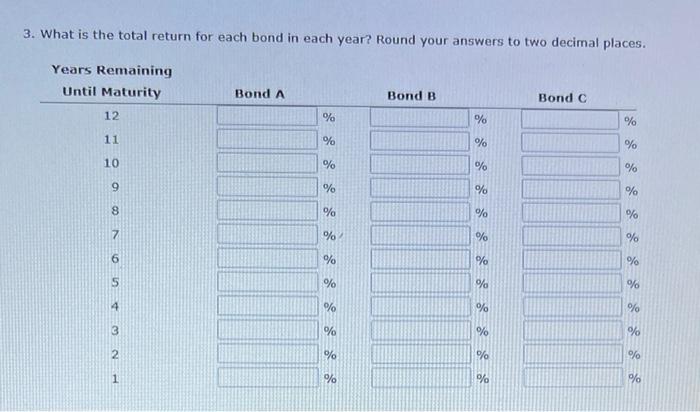
Ch 07 - Excel Online Structured Activity. Bond Valuation Question 1 0/10 Excel Online Structured Activity: Bond Valuation Submit Clifford Clark is a recent retiree who is interested in investing some of his savings in corporate bonds. His financial planner has suggested the following bonds: Bond A has an 8% annual coupon, matures in 12 years, and has a $1,000 face value. Bond B has a 10% annual coupon, matures in 12 years, and has a $1,000 face value Bond C has a 12% annual coupon, matures in 12 years, and has a $1,000 face value Each bond has a yield to maturity of 10%. The data has been collected in the Microsoft Excel Online file below. Open the spreadsheet and perform the required analysis to answer the questions below. Do not round Intermediate calculations. Use a minus sign to enter negative values, if any. If an answer is zero, enter"0" X Download spreadsheet Bond Valuation-2883b0.xlsx a. Before calculating the prices of the bonds, indicate whether each bond is trading at a premium, at a discount, or at par Bond A is selling at because its coupon rate is the going interest rate. Bond B is selling at because its coupon rate is the going interest rate. Bond C is selling at because its coupon rate is the going interest rate. b. Calculate the price of each of the three bonds. Round your answers to the nearest cent. Price (Bond A): $ Price (Bond B): $ Price (Bond C): $ C Calculate the current yield for each of the three bonds. (Hint: The expected current yield is calculated as the annual interest divided by the price of the bond.) Round your answers to two decimal places Current yield (Bond A): % Current yield (Bond B): % Current yield (Bond C): % d. If the yield to maturity for each bond remains at 10%, what will be the price of each bond 1 year from now? Round your answers to the nearest cent. Price (Bond A): $ Price (Bond B): $ Price (Bond C): $ What is the expected capital gains yield for each bond? What is the expected total return for each bond? Round your answers to two decimal places. Bond A Bond B Bond c % % % Expected capital gains yield Expected total return % % % e. Mr. Clark is considering another bond, Bond D. It has a 9% semiannual coupon and a $1,000 face value (i.e., it pays a $45 coupon every 6 months). Bond D is scheduled to mature in 8 years and has a price of $1,110. It is also callable in 5 years at a call price of $1,020. 1. What is the bond's nominal yield to maturity? Round your answer to two decimal places. % 2. What is the bond's nominal yield to call? Round your answer to two decimal places. % 3. If Mr. Clark were to purchase this bond, would he be more likely to receive the yield to maturity or yield to call? Explain your answer. the YTC, Mr. Clark expect the bond to be called Because the YTM is Consequently, he would earn f. Explain briefly the difference between price risk and reinvestment risk. The risk of This risk of a decline in bond values due to an increase in interest rates is called an income decline due to a drop in interest rates is called V Which of the following bonds has the most price risk? Which has the most reinvestment risk? A 1-year bond with a 10% annual coupon A 5-year bond with a 10% annual coupon . A 5-year bond with a zero coupon A 10-year bond with a 10% annual coupon A 10-year bond with a zero coupon A has the most price risk. A y has the most reinvestment risk. 9. Calculate the price of each bond (A, B, and c) at the end of each year until maturity, assuming interest rates remain constant. Round your answers to the nearest cent. y. LLUIOLE C MILOVICOLI UUIUM, GHULOLLIG CITU I COL Y CON UOLUEILY GUY FUCECOCIOLO remain constant. Round your answers to the nearest cent. Years Remaining Until Maturity Bond A Bond B Bond C 12 $ $ 11 $ $ $ $ 10 $ 9 $ $ $ $ $ 8 $ $ 7 $ $ $ $ 6 $ $ 5 un $ $ $ $ 4 $ 3 $ $ 2 $ $ $ $ $ $ $ 1 $ $ 0 $ $ Create a graph showing the time path of each bond's value. Choose the correct graph. The correct graph is V A. Time Paths of Bonds A, B and C B. Time Path $1,400 $1,400 $1,200 $1,200 $1,000 $1,000 5800 5800 Bond Valux Bond Value $600 5600 $400 $400 $200 $200 SO so 12 9 0 12 6 Years Remaining Until Maturity Years 1. What is the expected current yield for each bond in each year? Round your answers to two decimal places. Years Remaining Until Maturity 12 Bond A Bond B Bond C % % % 11 % % % % 10 % % 9 % % % 8 % % % 7 % % % % % % % % % NUO % % % % % % % % % 1 % % % 2. What is the expected capital gains yield for each bond in each year? Round your answers to two decimal 2. What is the expected capital gains yield for each bond in each year? Round your answers to two decimal places. Years Remaining Until Maturity 12 Bond A Bond B Bond C % % % 11 % % % 10 % % % 9 % % % 8 % % % 7 % % % % % % % % % NUO % % % % % % % % % 1 % % % 3. What is the total return for each bond in each year? Round your answers to two decimal places. Years Remaining Until Maturity Bond A Bond B Bond C 12 % % % 11 % % % 10 % % % 9 % % % 8 % % % 7 % % % 6 % % % S % % % 4 % % % 3 % % % 2 % % % 1 % % %
Step by Step Solution
There are 3 Steps involved in it

Get step-by-step solutions from verified subject matter experts