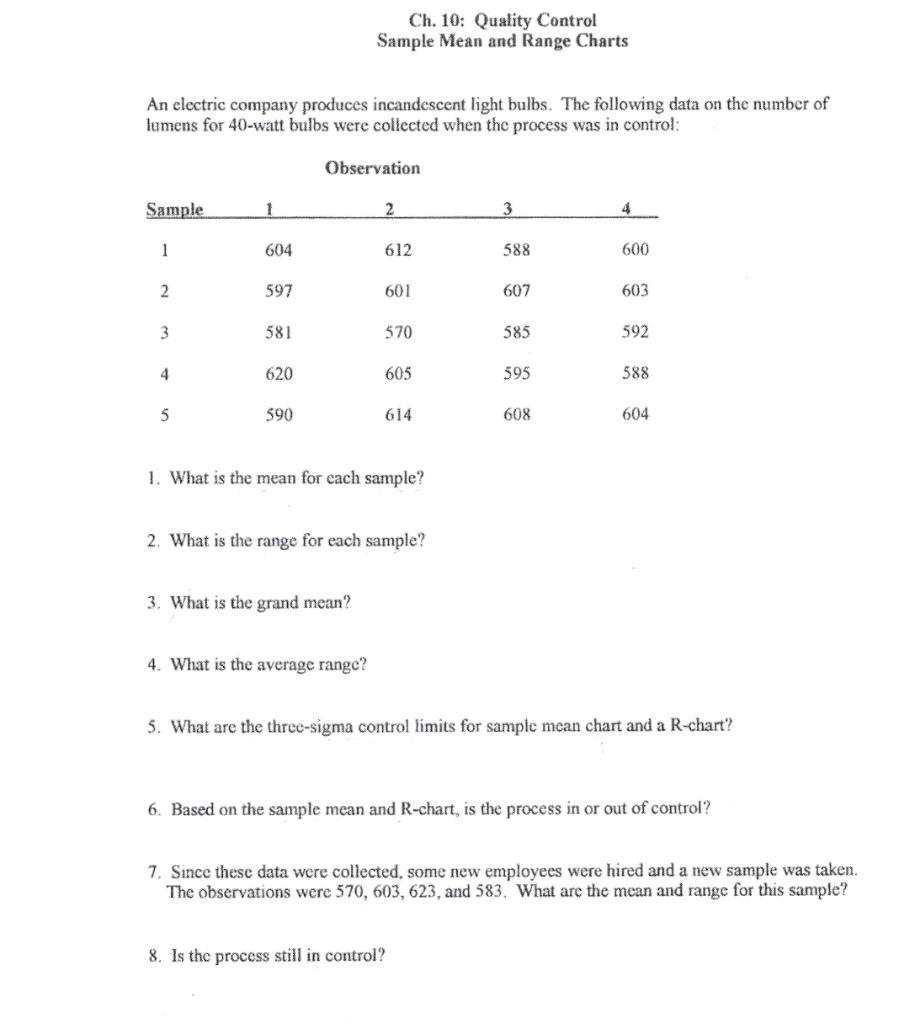
Question: Ch. 10: Quality Control Sample Mean and Range Charts An electric company produces incandescent light bulbs. The following data on the number of lumens for

Ch. 10: Quality Control Sample Mean and Range

Ch. 10: Quality Control Sample Mean and Range Charts An electric company produces incandescent light bulbs. The following data on the number of lumens for 40-watt bulbs were collected when the process was in control: Observation Sample 1 2 3 1 604 612 588 600 2 597 601 607 603 3 581 570 585 592 4 620 605 595 588 5 590 614 608 604 1. What is the mean for each sample? 2. What is the range for each sample? 3. What is the grand mean? 4. What is the average range? 5. What are the three-sigma control limits for sample mcan chart and a R-chart? 6. Based on the sample mean and R-chart, is the process in or out of control? 7. Since these data were collected, some new employees were hired and a new sample was taken. The observations were 570, 603, 623, and 583. What are the mean and range for this sample? 8. Is the process still in control

Step by Step Solution

There are 3 Steps involved in it

1 Expert Approved Answer
Step: 1 Unlock blur-text-image
Question Has Been Solved by an Expert!

Get step-by-step solutions from verified subject matter experts

Step: 2 Unlock
Step: 3 Unlock

Students Have Also Explored These Related General Management Questions!