Question: please help with a and b QUESTION 1 Solve Problem 1 in Chapter 3 in your Textbook OUCL(Range) = 24.16 sec; LCL(Range) =3.84 sec; UCL(Sample

please help with a and b please help with a and b QUESTION 1 Solve Problem
please help with a and b QUESTION 1 Solve Problem
QUESTION 1 Solve Problem 1 in Chapter 3 in your Textbook OUCL(Range) = 24.16 sec; LCL(Range) =3.84 sec; UCL(Sample mean) =290.37 sec; LCL(Sample mean) =230.63 sec UCL(Range) =18.16 sec; LCL(Range) =1.84 sec; UCL(Sample mean) =393.37 sec; LCL(Sample mean) =386.63 sec UCL(Range) = 48.16 sec; LCL(Range) =11.84 sec; UCL(Sample mean) =593.37 sec; LCL(Sample mean) =586.63 sec UCL(Range) =8.16 sec; LCL(Range) =6.84 sec; UCL(Sample mean) =493.37 sec; LCL(Sample mean) =486.63 sec or X + 673/cfi/6/1421/4/2/4/4@0.100 The Watson Electric Company produces incandescent lightbulbs. The following data on the number of lumens for 40-watt lightbulbs were collected when the process was in control. OBSERVATION Sample 1 N 3 1 604 612 588 600 2 597 601 607 603 3 581 570 585 592 4 620 605 595 588 5 590 614 608 604 Aa 70 8 >> 2 7:17 PM 09/25/2020 6 8 9 O u Tulkl P H on x + 573/cfi/6/142/4/2/8/2/4/10/2/2@0:100 a. Calculate control limits for an R-chart and an -chart b. Since these data were collected, some new employees were hired. A new sample obtained th following readings: 625, 592, 612, and 635. Is the process still in control? Solution a. To calculate , compute the mean for each sample. To calculate R, subtract the lowest value in the sample from the highest value in the sample. For example, for sample 1, 604612+588 +600 601 R = 612 - 588 = 24 QUESTION 1 Solve Problem 1 in Chapter 3 in your Textbook OUCL(Range) = 24.16 sec; LCL(Range) =3.84 sec; UCL(Sample mean) =290.37 sec; LCL(Sample mean) =230.63 sec UCL(Range) =18.16 sec; LCL(Range) =1.84 sec; UCL(Sample mean) =393.37 sec; LCL(Sample mean) =386.63 sec UCL(Range) = 48.16 sec; LCL(Range) =11.84 sec; UCL(Sample mean) =593.37 sec; LCL(Sample mean) =586.63 sec UCL(Range) =8.16 sec; LCL(Range) =6.84 sec; UCL(Sample mean) =493.37 sec; LCL(Sample mean) =486.63 sec or X + 673/cfi/6/1421/4/2/4/4@0.100 The Watson Electric Company produces incandescent lightbulbs. The following data on the number of lumens for 40-watt lightbulbs were collected when the process was in control. OBSERVATION Sample 1 N 3 1 604 612 588 600 2 597 601 607 603 3 581 570 585 592 4 620 605 595 588 5 590 614 608 604 Aa 70 8 >> 2 7:17 PM 09/25/2020 6 8 9 O u Tulkl P H on x + 573/cfi/6/142/4/2/8/2/4/10/2/2@0:100 a. Calculate control limits for an R-chart and an -chart b. Since these data were collected, some new employees were hired. A new sample obtained th following readings: 625, 592, 612, and 635. Is the process still in control? Solution a. To calculate , compute the mean for each sample. To calculate R, subtract the lowest value in the sample from the highest value in the sample. For example, for sample 1, 604612+588 +600 601 R = 612 - 588 = 24

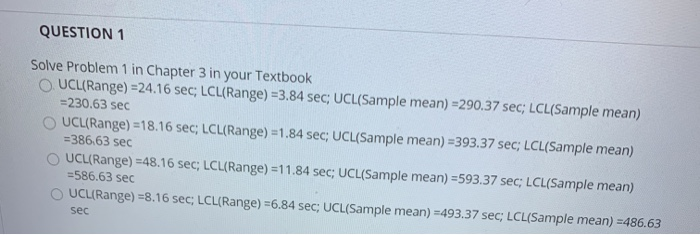
Step by Step Solution

There are 3 Steps involved in it

1 Expert Approved Answer
Step: 1 Unlock blur-text-image
Question Has Been Solved by an Expert!

Get step-by-step solutions from verified subject matter experts

Step: 2 Unlock
Step: 3 Unlock

Students Have Also Explored These Related General Management Questions!