

Question: Ch 17 HW a 0 Saved Help Save & Exit Submit Check my work Problem 17-1A Calculation and analysis of trend percents LO A1, P1
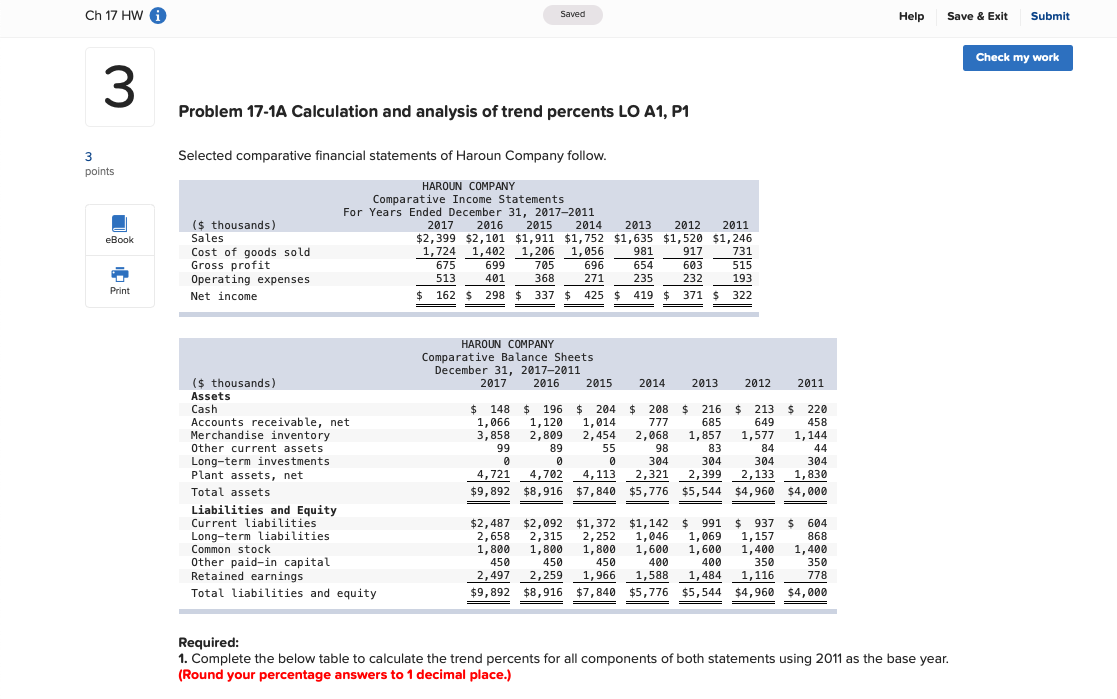
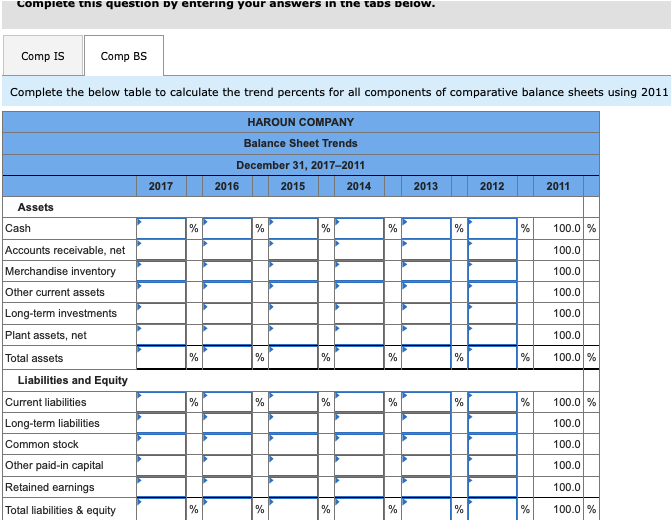
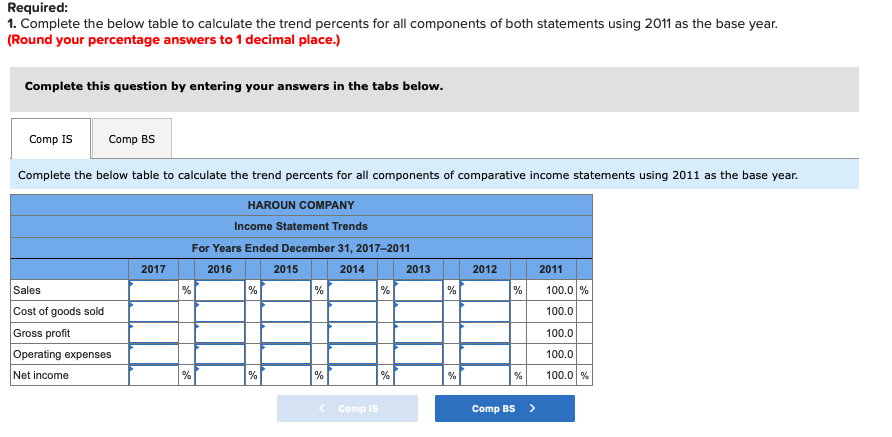
Ch 17 HW a 0 Saved Help Save & Exit Submit Check my work Problem 17-1A Calculation and analysis of trend percents LO A1, P1 Selected comparative financial statements of Haroun Company follow. 3 points eBook ($ thousands) Sales Cost of goods sold Gross profit Operating expenses Net income HAROUN COMPANY Comparative Income Statements For Years Ended December 31, 2017-2011 2017 2016 2015 2014 2013 2012 2011 $2,399 $2,101 $1,911 $1,752 $1,635 $1,520 $1,246 1,724 1,402 1,206 1,056 981 917 731 675 699 705 696 654 603 515 513 401 368 271 235 232 193 $ 162 $ 298 $ 337 $ 425 $ 419 $ 371 $ 322 Print HAROUN COMPANY Comparative Balance Sheets December 31, 2017-2011 2017 2016 2015 2014 2013 2012 2011 ($ thousands) Assets Cash Accounts receivable, net Merchandise inventory Other current assets Long-term investments Plant assets, net Total assets Liabilities and Equity Current liabilities Long-term liabilities Common stock Other paid-in capital Retained earnings Total liabilities and equity $ 148 148 $ 196 $ 204 $ 208 208 $ 216 $ 216 $ 213 $ 220 1,066 1,120 1,014 777 685 649 458 3,858 2,809 2,454 2,068 1,857 1,577 1,144 99 89 55 98 83 44 0 0 304 304 304 304 4,721 4,702 4,113 2,321 2,399 2,133 1,830 $9,892 $8,916 $7,840 $5,776 $5,544 $4,960 $4,000 84 $2,487 $2,092 $1,372 $1,142 $ $ 991 2,658 2,315 2,252 1,046 1,069 1,800 1,800 1,800 1,600 1,600 450 450 450 400 400 2,497 2,259 1,966 1,588 1,484 $9,892 $8,916 $7,840 $5,776 $5,544 $ 937 $ 604 1,157 868 1,400 1,400 350 350 1,116 778 $4,960 $4,000 Required: 1. Complete the below table to calculate the trend percents for all components of both statements using 2011 as the base year. (Round your percentage answers to 1 decimal place.) Complete this question by entering your answers in the tabs below. Comp IS Comp BS Complete the below table to calculate the trend percents for all components of comparative balance sheets using 2011 HAROUN COMPANY Balance Sheet Trends December 31, 2017-2011 2017 2016 2015 2014 2013 2012 2011 Assets Cash % % % % % % 100.0 % 100.0 100.0 100.0 100.0 100.0 % % % % % % 100.0 % Accounts receivable, net Merchandise inventory Other current assets Long-term investments Plant assets, net Total assets Liabilities and Equity Current liabilities Long-term liabilities Common stock Other paid-in capital Retained earnings Total liabilities & equity % % % % % % 100.0 % 100.0 100.0 100.0 100.0 % % % % % % 100.0 % Required: 1. Complete the below table to calculate the trend percents for all components of both statements using 2011 as the base year. (Round your percentage answers to 1 decimal place.) Complete this question by entering your answers in the tabs below. Comp IS Comp BS Complete the below table to calculate the trend percents for all components of comparative income statements using 2011 as the base year. HAROUN COMPANY Income Statement Trends For Years Ended December 31, 2017-2011 2017 2016 2015 2014 2013 2012 2011 % % % % % % 100.0 % 100.0 Sales Cost of goods sold Gross profit Operating expenses 100.0 100.0 Net income % % % % % % 100.0 % Comp Is Comp BS
Step by Step Solution
There are 3 Steps involved in it

Get step-by-step solutions from verified subject matter experts