

Question: Need help with the following accounting problem. Problem 17-1A Calculation and analysis of trend percents LO A1, P1 Selected comparative financial statements of Haroun Company
Need help with the following accounting problem.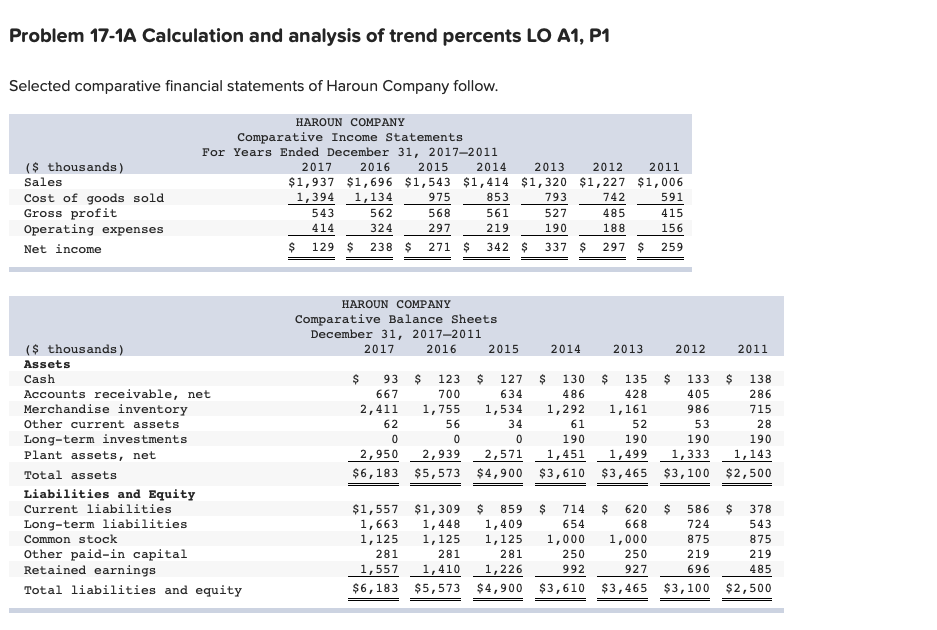
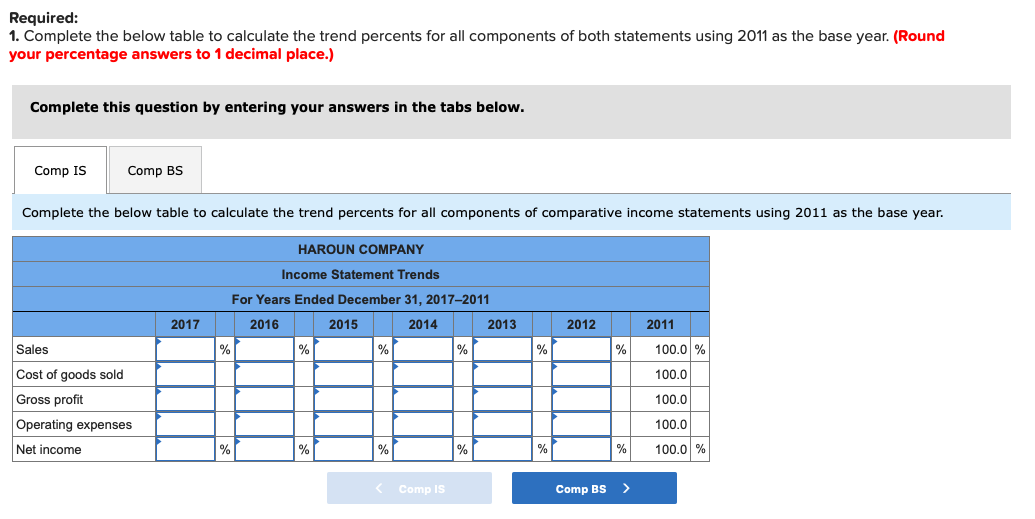
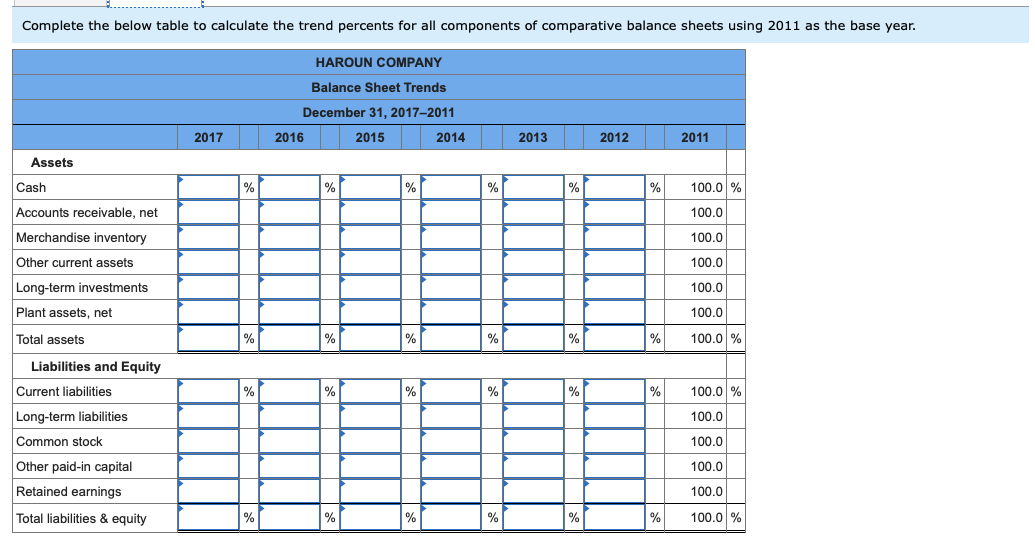
Problem 17-1A Calculation and analysis of trend percents LO A1, P1 Selected comparative financial statements of Haroun Company follow. ($ thousands) Sales Cost of goods sold Gross profit Operating expenses Net income HAROUN COMPANY Comparative Income Statements For Years Ended December 31, 20172011 2017 2016 2015 2014 2013 2012 $1,937 $1,696 $1,543 $1,414 $1,320 $1,227 1,394 1,134 975 853 853793742 543 562 568 561527 485 414 324 219 190 $ 129 $ 238 $ 271 $ 342 $ 337 $ 297 2011 $1,006 591 297 188 $ 259 HAROUN COMPANY Comparative Balance Sheets December 31, 20172011 2017 2016 2015 2014 2013 2012 2011 $ 93 $ 123 667 700 2,411 1,755 62 56 $ 127 634 1,534 34 ($ thousands) Assets Cash Accounts receivable, net Merchandise inventory Other current assets Long-term investments Plant assets, net Total assets Liabilities and Equity Current liabilities Long-term liabilities Common stock Other paid-in capital Retained earnings Total liabilities and equity $ 130 486 1,292 61 190 1,451 $3,610 $ 135 428 1,161 52 190 1,499 $3,465 $ 133 405 986 53 190 1,333 $3,100 $ 138 286 715 28 190 1,143 $2,500 0 2,950 $6,183 2,939 $5,573 2,571 $4,900 $ 620 668 1,000 $1,557 $1,309 1,663 1,448 1,125 1,125 281 281 1,557 1,410 $6,183 $5,573 $ 859 $ 714 1,409 654 1,125 1,000 281 1,226 992 $4,900 $3,610 $ 586 724 875 219 696 $3,100 $ 378 543 875 219 485 $2,500 927 $3,465 Required: 1. Complete the below table to calculate the trend percents for all components of both statements using 2011 as the base year. (Round your percentage answers to 1 decimal place.) Complete this question by entering your answers in the tabs below. Comp IS Comp BS Complete the below table to calculate the trend percents for all components of comparative income statements using 2011 as the base year. HAROUN COMPANY Income Statement Trends For Years Ended December 31, 2017-2011 2016 2015 2014 2013 % % % 2017 2012 % % Sales Cost of goods sold Gross profit Operating expenses Net income 2011 100.0 % 100.0 100.0 100.0 100.0 % % Complete the below table to calculate the trend percents for all components of comparative balance sheets using 2011 as the base year. WANT HAROUN COMPANY Balance Sheet Trends December 31, 2017-2011 2016 2015 2014 2017 2013 2012 2011 Assets 100.0 % 100.0 100.0 100.0 100.0 100.0 100.0 % Cash Accounts receivable, net Merchandise inventory Other current assets Long-term investments Plant assets, net Total assets Liabilities and Equity Current liabilities Long-term liabilities Common stock Other paid-in capital Retained earnings Total liabilities & equity % % % 100.0 % 100.0 100.0 100.0 100.0 100.0 %
Step by Step Solution
There are 3 Steps involved in it

Get step-by-step solutions from verified subject matter experts