

Question: (Ch12-EOC-Q10&11) please answer. For Q11 (the third question with the missing blanks), for 1 answer selections are no you couldn't or yes you could and

(Ch12-EOC-Q10&11) please answer. For Q11 (the third question with the missing blanks), for "1" answer selections are "no you couldn't" or "yes you could" and for the 2nd blank, selections are: "the study compares only two treatments/ the power would be too small/ the study compares 35 treatments/ the risk of a type 1 error would be too great" - select correct answer to make the statement true. Please answer all questions (total of 5 needed).
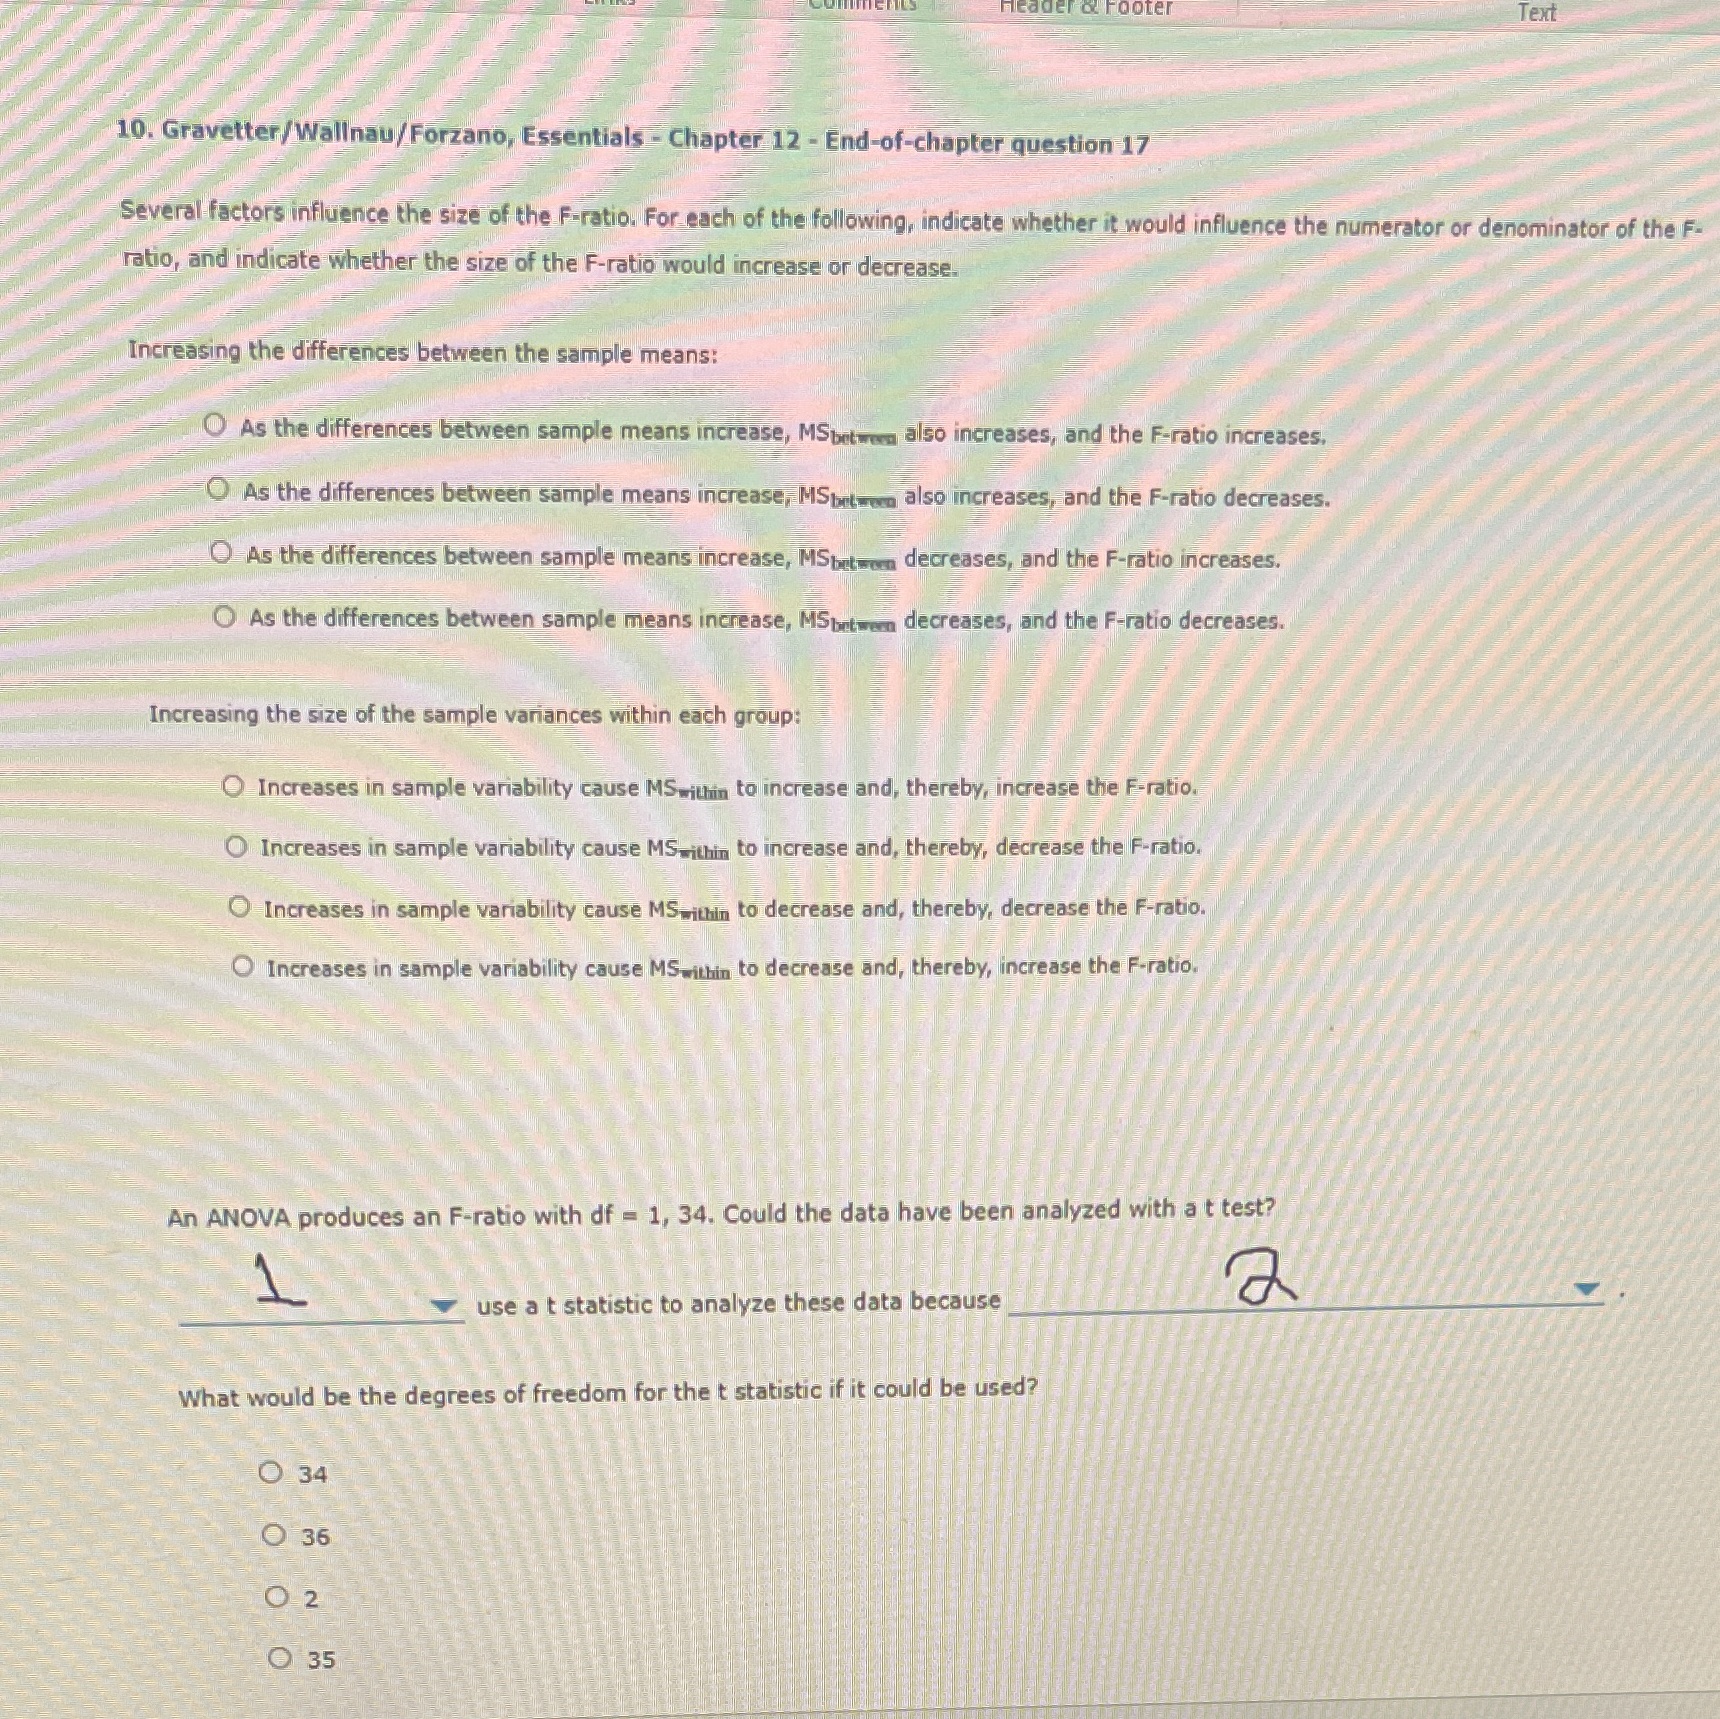
10. Gravetter/Wallnau/Forzano, Essentials - Chapter 12 - End-of-chapter question 17 Several factors influence the size of the F-ratio. For each of the following, indicate whether it would influence the numerator or denominator of the F- ratio, and indicate whether the size of the F-ratio would increase or decrease. Increasing the differences between the sample means: As the differences between sample means increase, MSbetween also increases, and the F-ratio increases, O. As the differences between sample means increase, MSbetween also increases, and the F-ratio decreases. O As the differences between sample means increase, MSbatsor decreases, and the F-ratio increases. As the differences between sample means increase, MSbetween decreases, and the F-ratio decreases. Increasing the size of the sample variances within each group: -Increases in sample variability cause MSwithin to increase and, thereby, increase the F-ratio. Increases in sample variability cause MSwithin to increase and, thereby, decrease the F-ratio. O Increases in sample variability cause MSwithin to decrease and, thereby, decrease the F-ratio. Increases in sample variability cause MSwithin to decrease and, thereby, increase the F-ratio. An ANOVA produces an F-ratio with of = 1, 34. Could the data have been analyzed with a t test? 1 use a t statistic to analyze these data because What would be the degrees of freedom for the t statistic if it could be used? O 34 O 36 2 35
Step by Step Solution
There are 3 Steps involved in it

Get step-by-step solutions from verified subject matter experts