

Question: (Ch12-prob set-Q3) please answer the question in the image. The answer selections for the 1st missing blank (complete the sentence), is close to 1.00 or
(Ch12-prob set-Q3) please answer the question in the image. The answer selections for the 1st missing blank (complete the sentence), is "close to 1.00" or "larger than 1.00". The answer selections for the 2nd blank is "null hypothesis will be rejected" or "null hypothesis won't be rejected". Please be sure to answer the question in the image pertaining to "data set a & b" as well. (3 answers total will need to be provided)
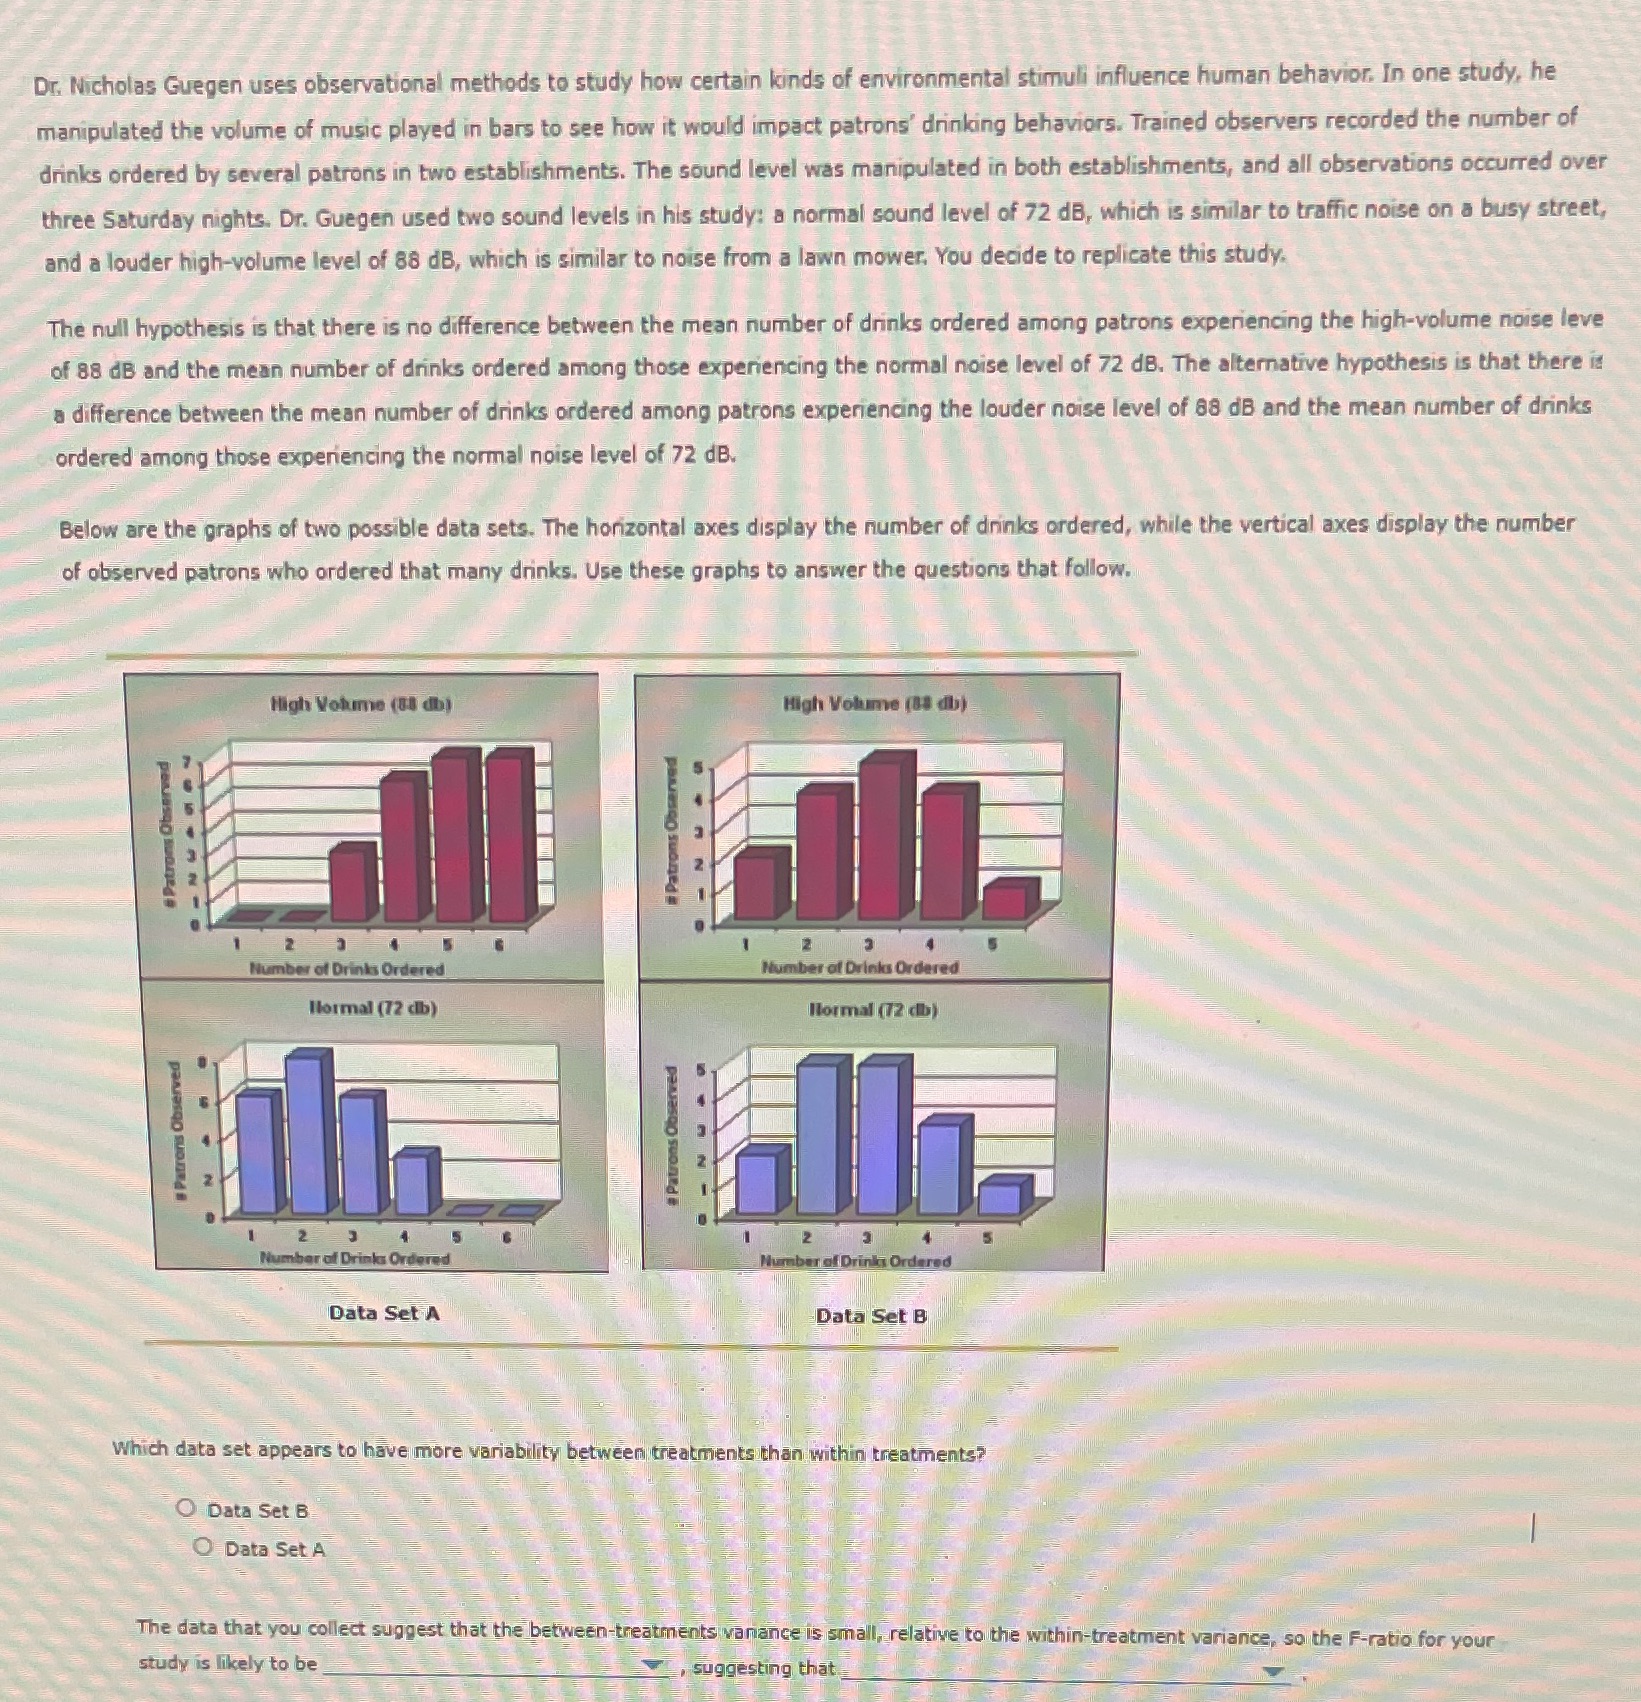
Dr. Nicholas Guegen uses observational methods to study how certain kinds of environmental stimuli influence human behavior. In one study, he manipulated the volume of music played in bars to see how it would impact patrons' drinking behaviors. Trained observers recorded the number of drinks ordered by several patrons in two establishments. The sound level was manipulated in both establishments, and all observations occurred over three Saturday nights. Dr. Guegen used two sound levels in his study: a normal sound level of 72 dB, which is similar to traffic noise on a busy street, and a louder high-volume level of 88 dB, which is similar to noise from a lawn mower. You decide to replicate this study. The null hypothesis is that there is no difference between the mean number of drinks ordered among patrons experiencing the high-volume noise leve of 88 dB and the mean number of drinks ordered among those experiencing the normal noise level of 72 dB. The alternative hypothesis is that there is a difference between the mean number of drinks ordered among patrons experiencing the louder noise level of 88 dB and the mean number of drinks ordered among those experiencing the normal noise level of 72 dB. Below are the graphs of two possible data sets. The horizontal axes display the number of drinks ordered, while the vertical axes display the number of observed patrons who ordered that many drinks. Use these graphs to answer the questions that follow. High Volume (80 dbj High Volume (83 db) # Patro nber of Drinks Ordered Number of Drinks Ordered Normal (72 clb) Normal (72 db) erved # Patrons Observed Patro aber of Drinks Ordered Data Set A Data Set B Which data set appears to have more variability between treatments than within treatments? O Data Set B O Data Set A The data that you collect suggest that the between-treatments vanance is small, relative to the within-treatment variance, so the F-ratio for your study is likely to be suggesting that
Step by Step Solution
There are 3 Steps involved in it

Get step-by-step solutions from verified subject matter experts