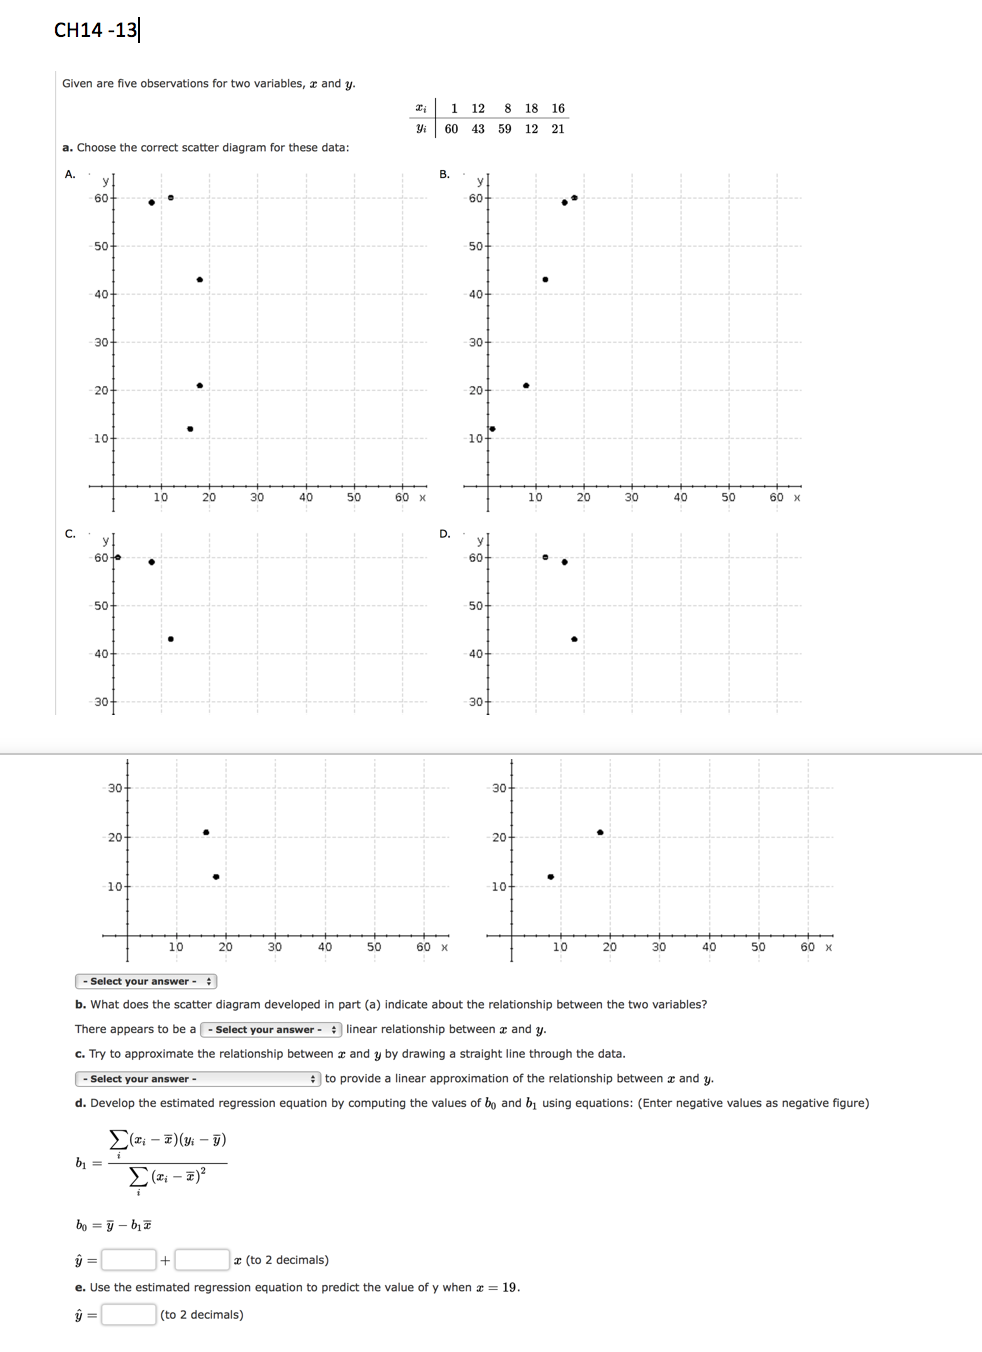
Question: CH14 -13 Given are five observations for two variables, 3 and y. 1 12 8 18 16 60 43 59 12 21 Yi a. Choose

CH14 -13 Given are five observations for two

CH14 -13 Given are five observations for two variables, 3 and y. 1 12 8 18 16 60 43 59 12 21 Yi a. Choose the correct scatter diagram for these data: A. B. 60 60 50 50 40 40 30 30 20 20 . 10+ 10+ 10 20 30 40 50 60 X 10 20 30 40 50 60 X C. D. 60 60 50 50+ 40- 40 307 30+ 30- 30 20 20 10 10 10 20 30 40 50 60 x 10 20 30 40 50 60 x - Select your answer - b. What does the scatter diagram developed in part (a) indicate about the relationship between the two variables? There appears to be a - Select your answer - linear relationship between 2 and y. C. Try to approximate the relationship between 2 and y by drawing a straight line through the data. - Select your answer - to provide a linear approximation of the relationship between 3 and y. d. Develop the estimated regression equation by computing the values of bo and by using equations: (Enter negative values as negative figure) (ti - 7)(y 5) bi = (xi - 7) bo = y - 1 y = + (to 2 decimals) e. Use the estimated regression equation to predict the value of y when c = 19. (to 2 decimals)

Step by Step Solution

There are 3 Steps involved in it

1 Expert Approved Answer
Step: 1 Unlock blur-text-image
Question Has Been Solved by an Expert!

Get step-by-step solutions from verified subject matter experts

Step: 2 Unlock
Step: 3 Unlock

Students Have Also Explored These Related General Management Questions!