

Question: Given are five observations for two variables, x and y. * 1 1 2 3 4 5 V1 4 7 5 11 13 (a) Develop
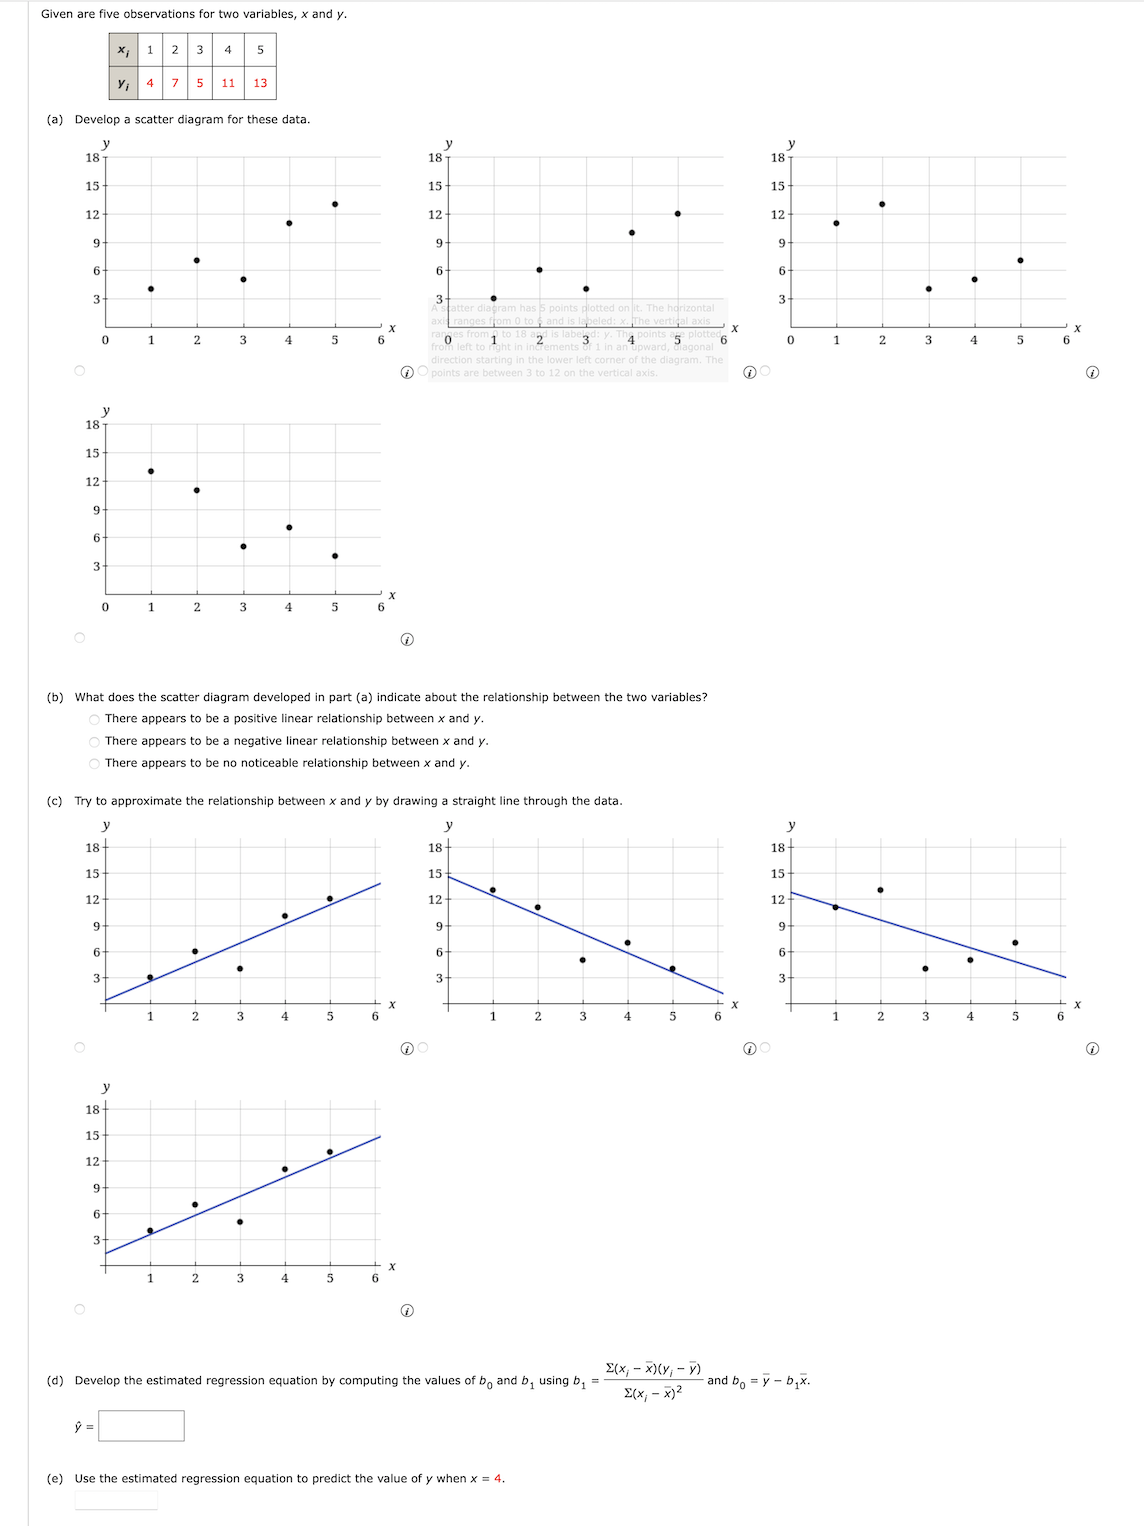
Given are five observations for two variables, x and y. * 1 1 2 3 4 5 V1 4 7 5 11 13 (a) Develop a scatter diagram for these data. 187 18 7 18 15 15- 12 12 12 3- 2 3 0 1 5 P 0 2 5 O 15 2 O (b) What does the scatter diagram developed in part (a) indicate about the relationship between the two variables? There appears to be a positive linear relationship between x and y. There appears to be a negative linear relationship between x and y. O There appears to be no noticeable relationship between x and y. (c) Try to approximate the relationship between x and y by drawing a straight line through the data. 18 18 18 15- 12 3- 3- 5 3 5 3 5 O 18+ 15 (d) Develop the estimated regression equation by computing the values of bo and b, using b, = = E( x , - x )(Yi - > and bo = y - b,x. E(x, - x)2 y = (e) Use the estimated regression equation to predict the value of y when x = 4
Step by Step Solution
There are 3 Steps involved in it

Get step-by-step solutions from verified subject matter experts