

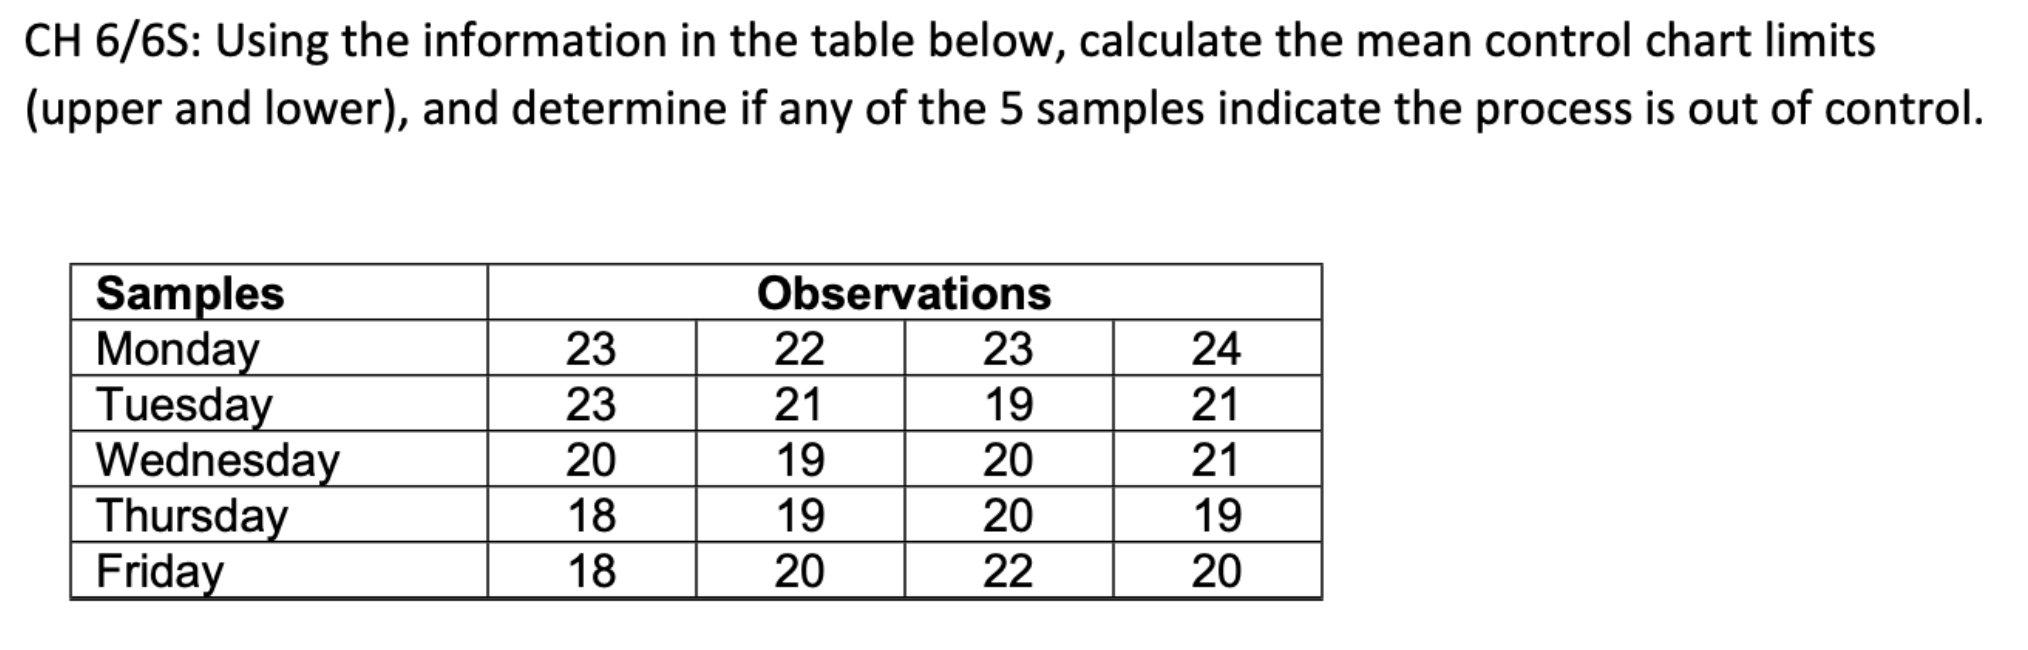
Question: CH6/6S : Using the information in the table below, calculate the mean control chart limits (upper and lower), and determine if any of the 5
Step by Step Solution
There are 3 Steps involved in it
1 Expert Approved Answer
Step: 1 Unlock

Question Has Been Solved by an Expert!
Get step-by-step solutions from verified subject matter experts
Step: 2 Unlock
Step: 3 Unlock