

Question: CHALLENGE ACTIVITY 3.3.2: Interpreting R2 Start A school is trying to determine if physical activity affects academic performance. The plot below shows the relationship between

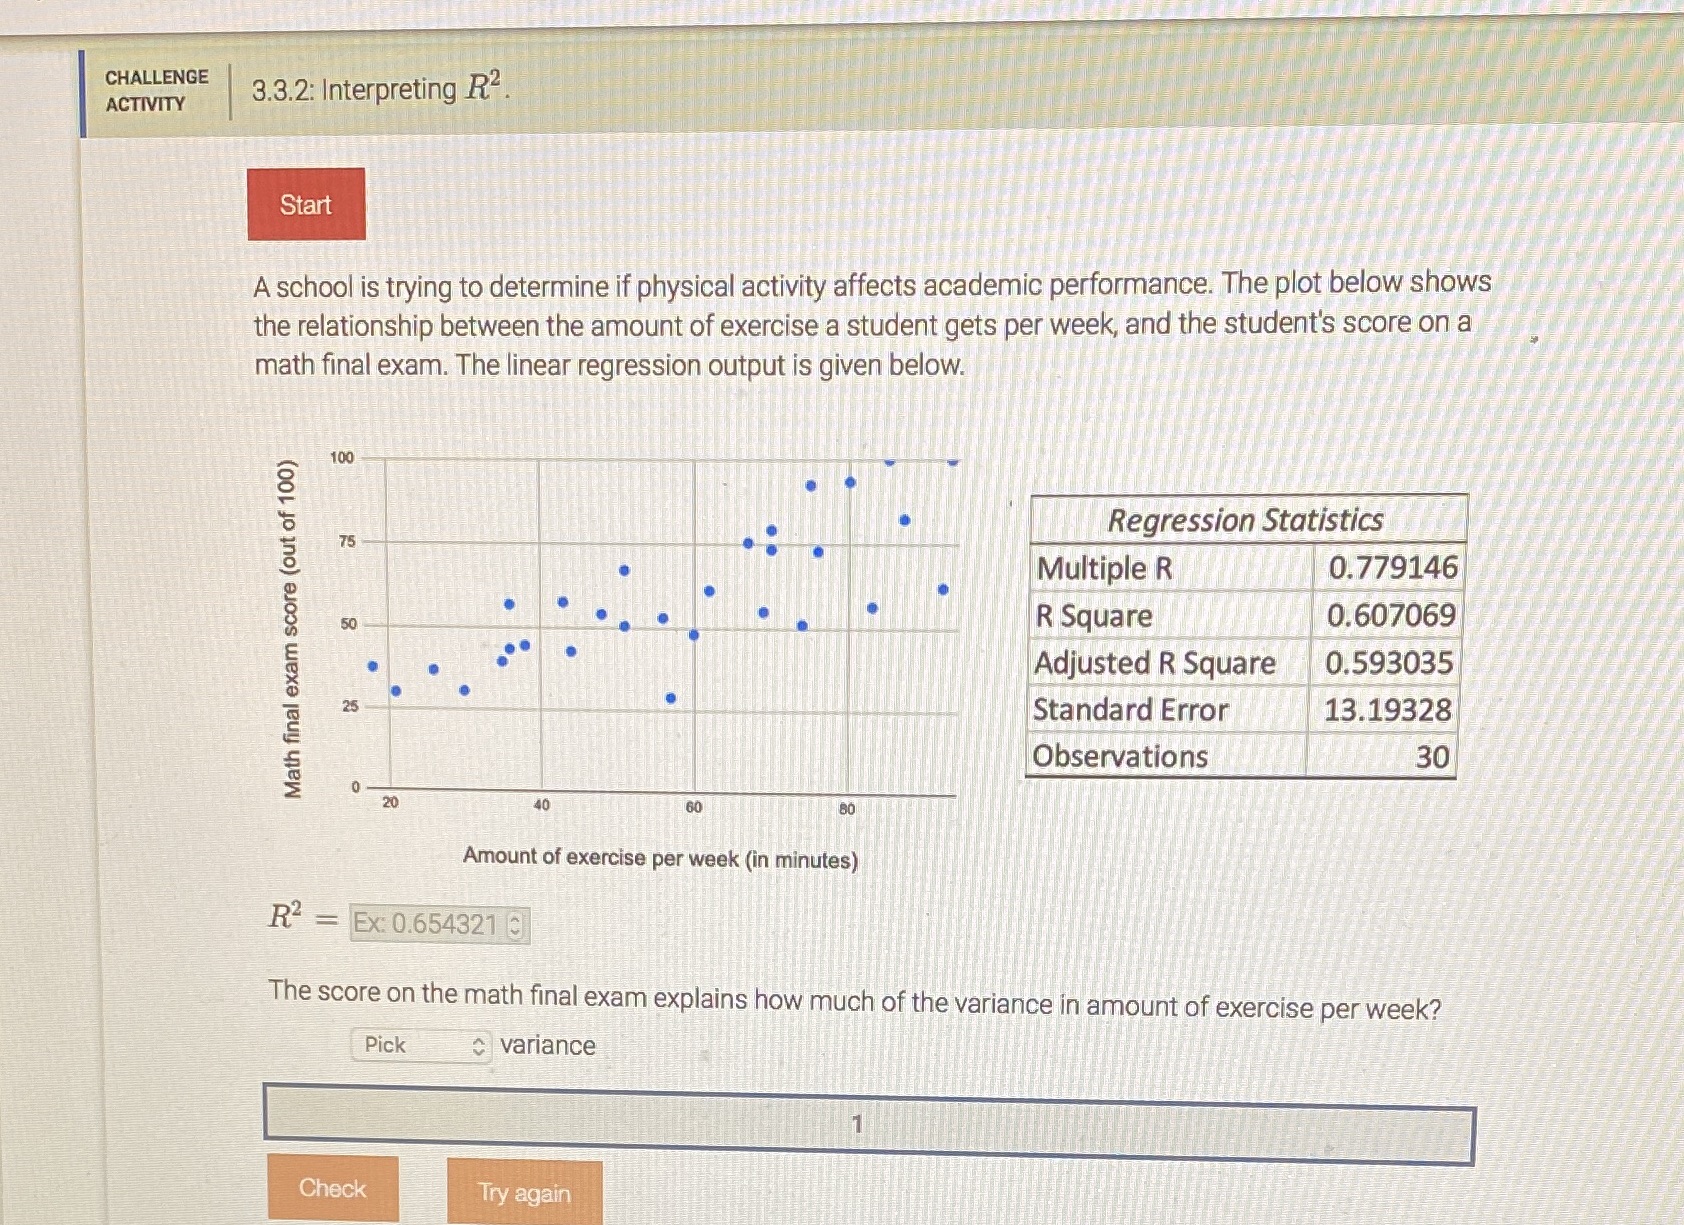
CHALLENGE ACTIVITY 3.3.2: Interpreting R2 Start A school is trying to determine if physical activity affects academic performance. The plot below shows the relationship between the amount of exercise a student gets per week, and the student's score on a math final exam. The linear regression output is given below. 100 Regression Statistics 75 Multiple R 0.779146 50 R Square 0.607069 Math final exam score (out of 100) Adjusted R Square 0.593035 Standard Error 13.19328 Observations 30 40 80 Amount of exercise per week (in minutes) R2 = Ex: 0.654321 3 The score on the math final exam explains how much of the variance in amount of exercise per week? Pick variance Check Try again
Step by Step Solution
There are 3 Steps involved in it

Get step-by-step solutions from verified subject matter experts