

Question: CHALLENGE ACTIVITY 7.1.4: Excel: Hypothesis test for a population proportion. Click this link to download the spreadsheet for use in this activity. 4560543063540.qxAzzy7 Jump to
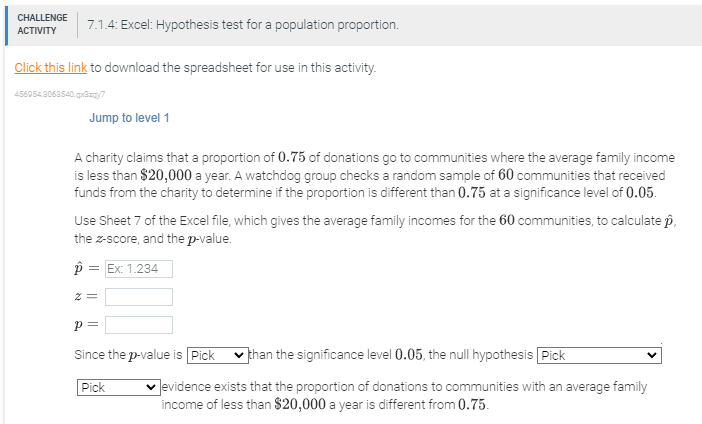
CHALLENGE ACTIVITY 7.1.4: Excel: Hypothesis test for a population proportion. Click this link to download the spreadsheet for use in this activity. 4560543063540.qxAzzy7 Jump to level 1 A charity claims that a proportion of 0.75 of donations go to communities where the average family income is less than $20,000 a year. A watchdog group checks a random sample of 60 communities that received funds from the charity to determine if the proportion is different than 0.75 at a significance level of 0.05. Use Sheet 7 of the Excel file, which gives the average family incomes for the 60 communities, to calculate p, the z-score, and the p-value. p = Ex: 1.234 P= Since the p-value is Pick v than the significance level 0.05, the null hypothesis Pick v Pick Jevidence exists that the proportion of donations to communities with an average family income of less than $20,000 a year is different from 0.75
Step by Step Solution
There are 3 Steps involved in it

Get step-by-step solutions from verified subject matter experts