

Question: CHALLENGE ACTIVITY 7.1.4: Excel: Hypothesis test for a population proportion. Click this link to download the spreadsheet for use in this activity. 414214.2658566.qx3zay7 Start In
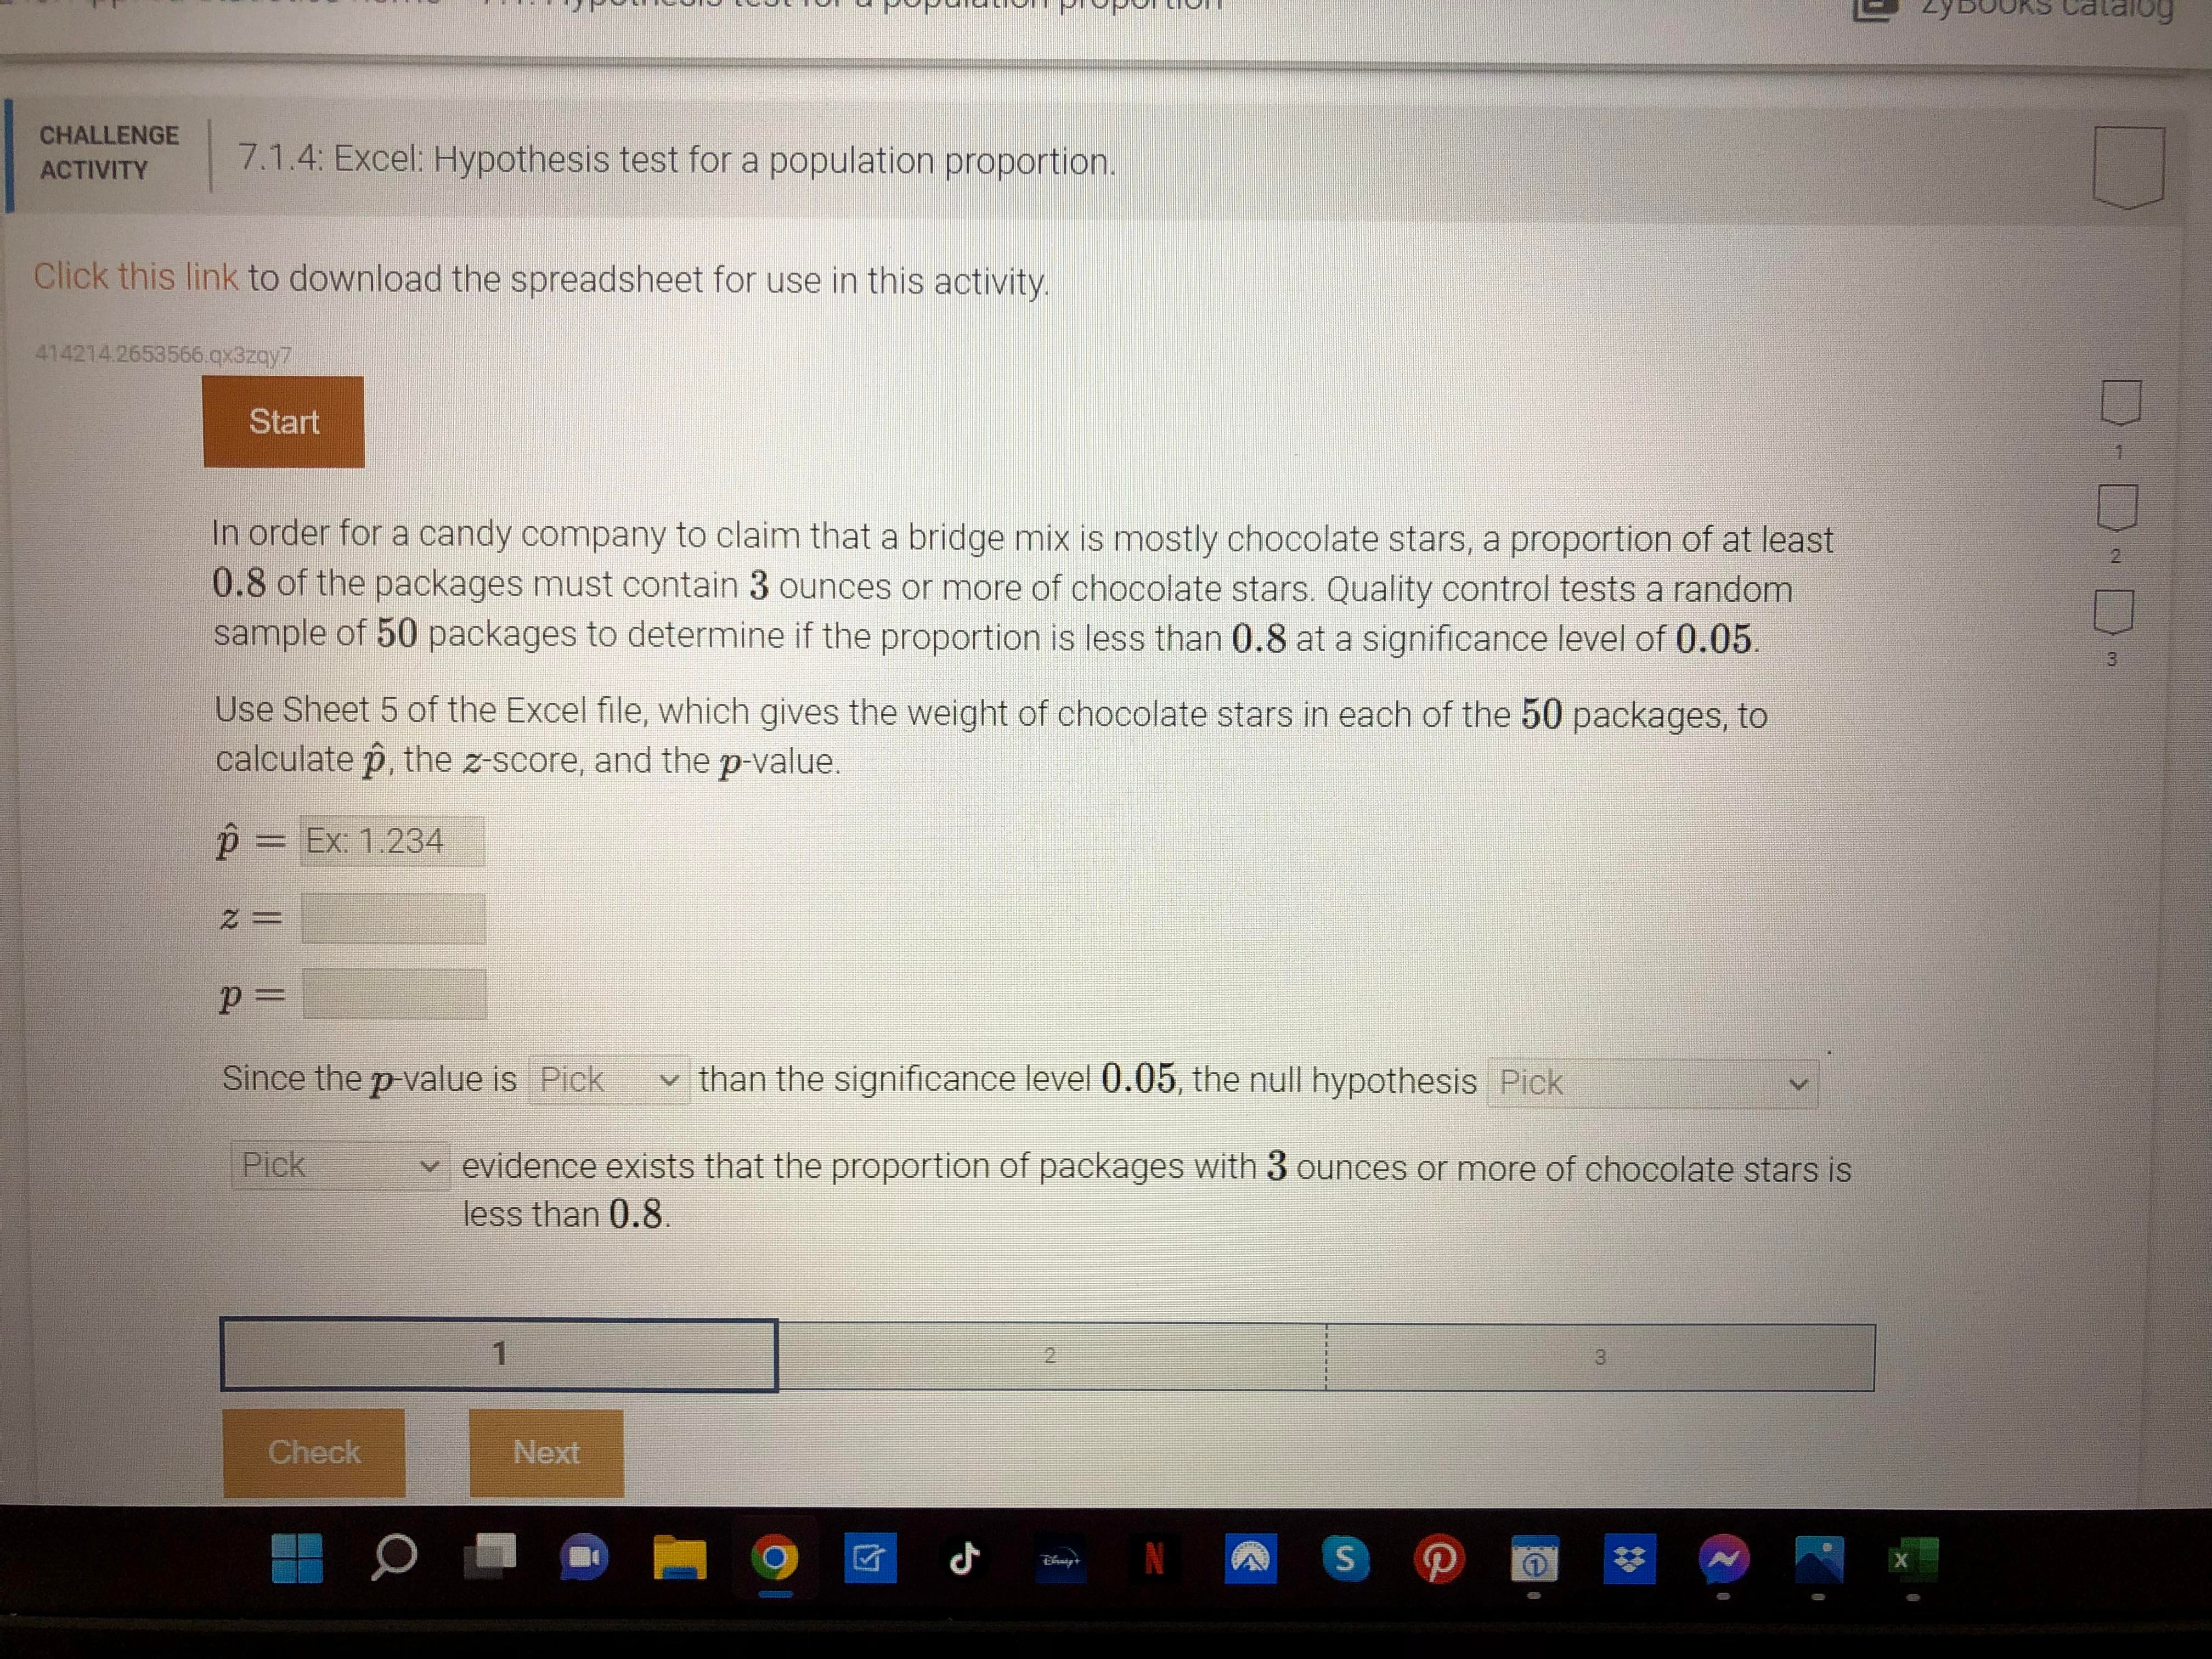
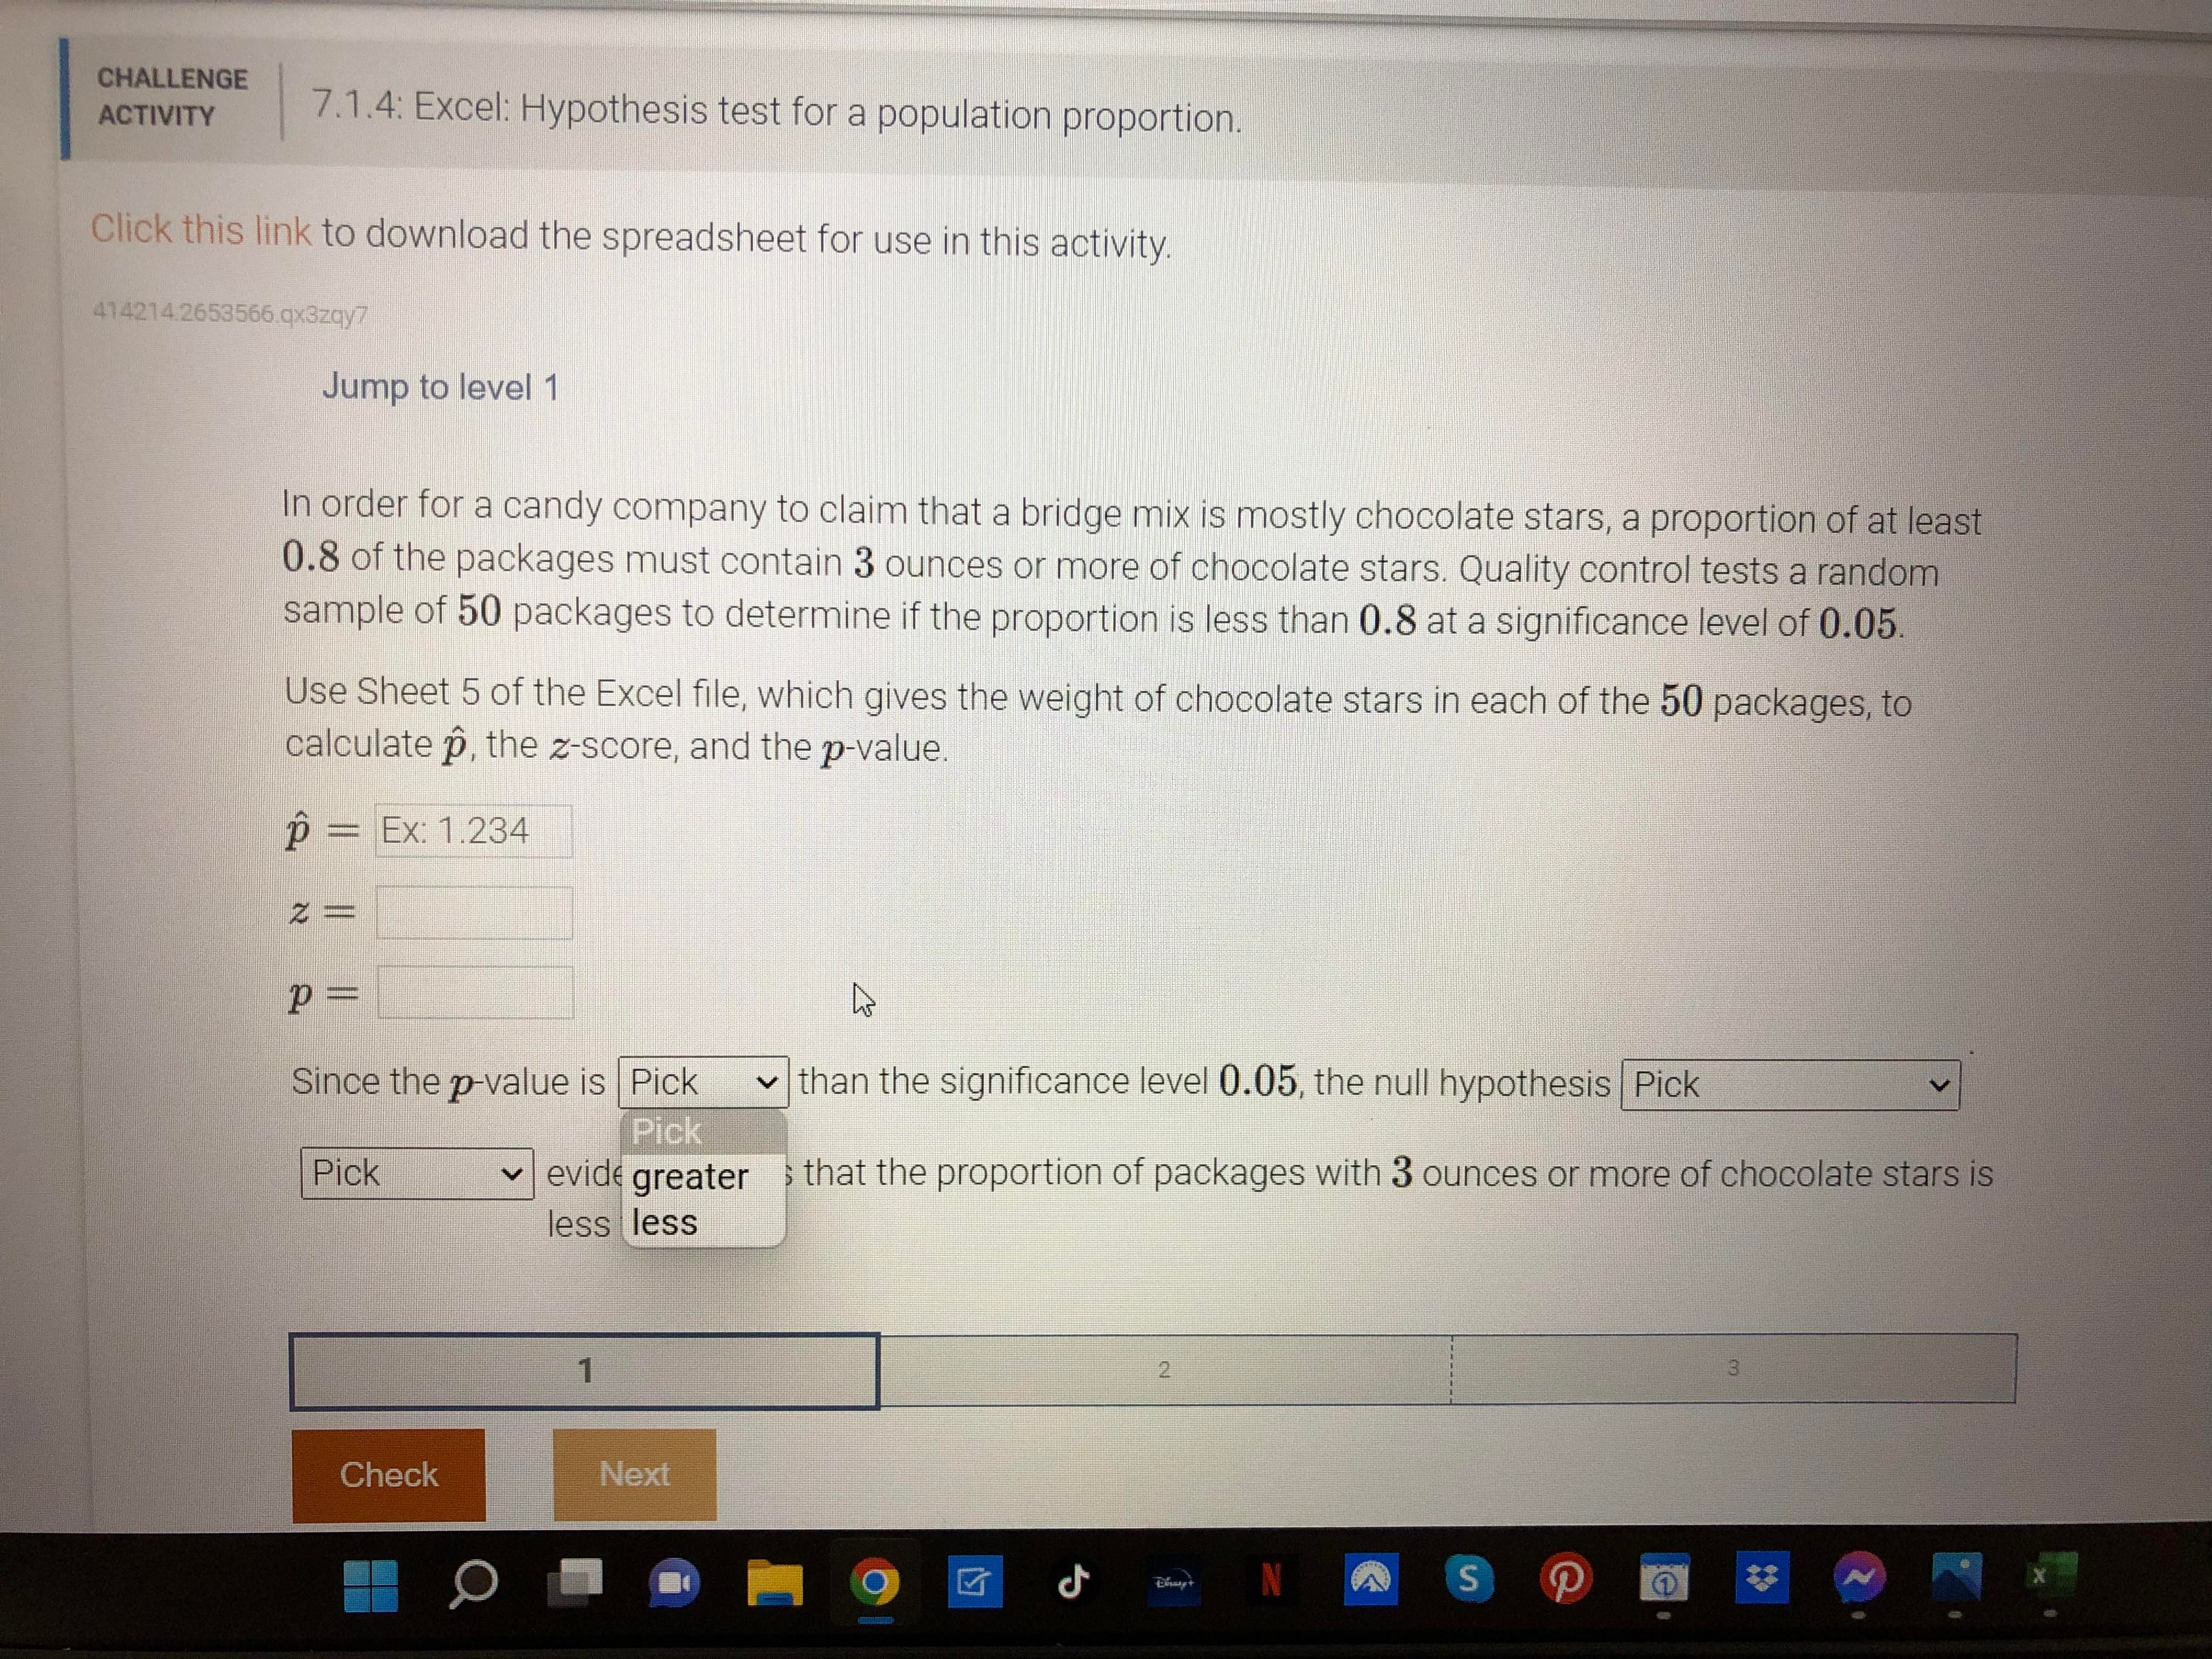
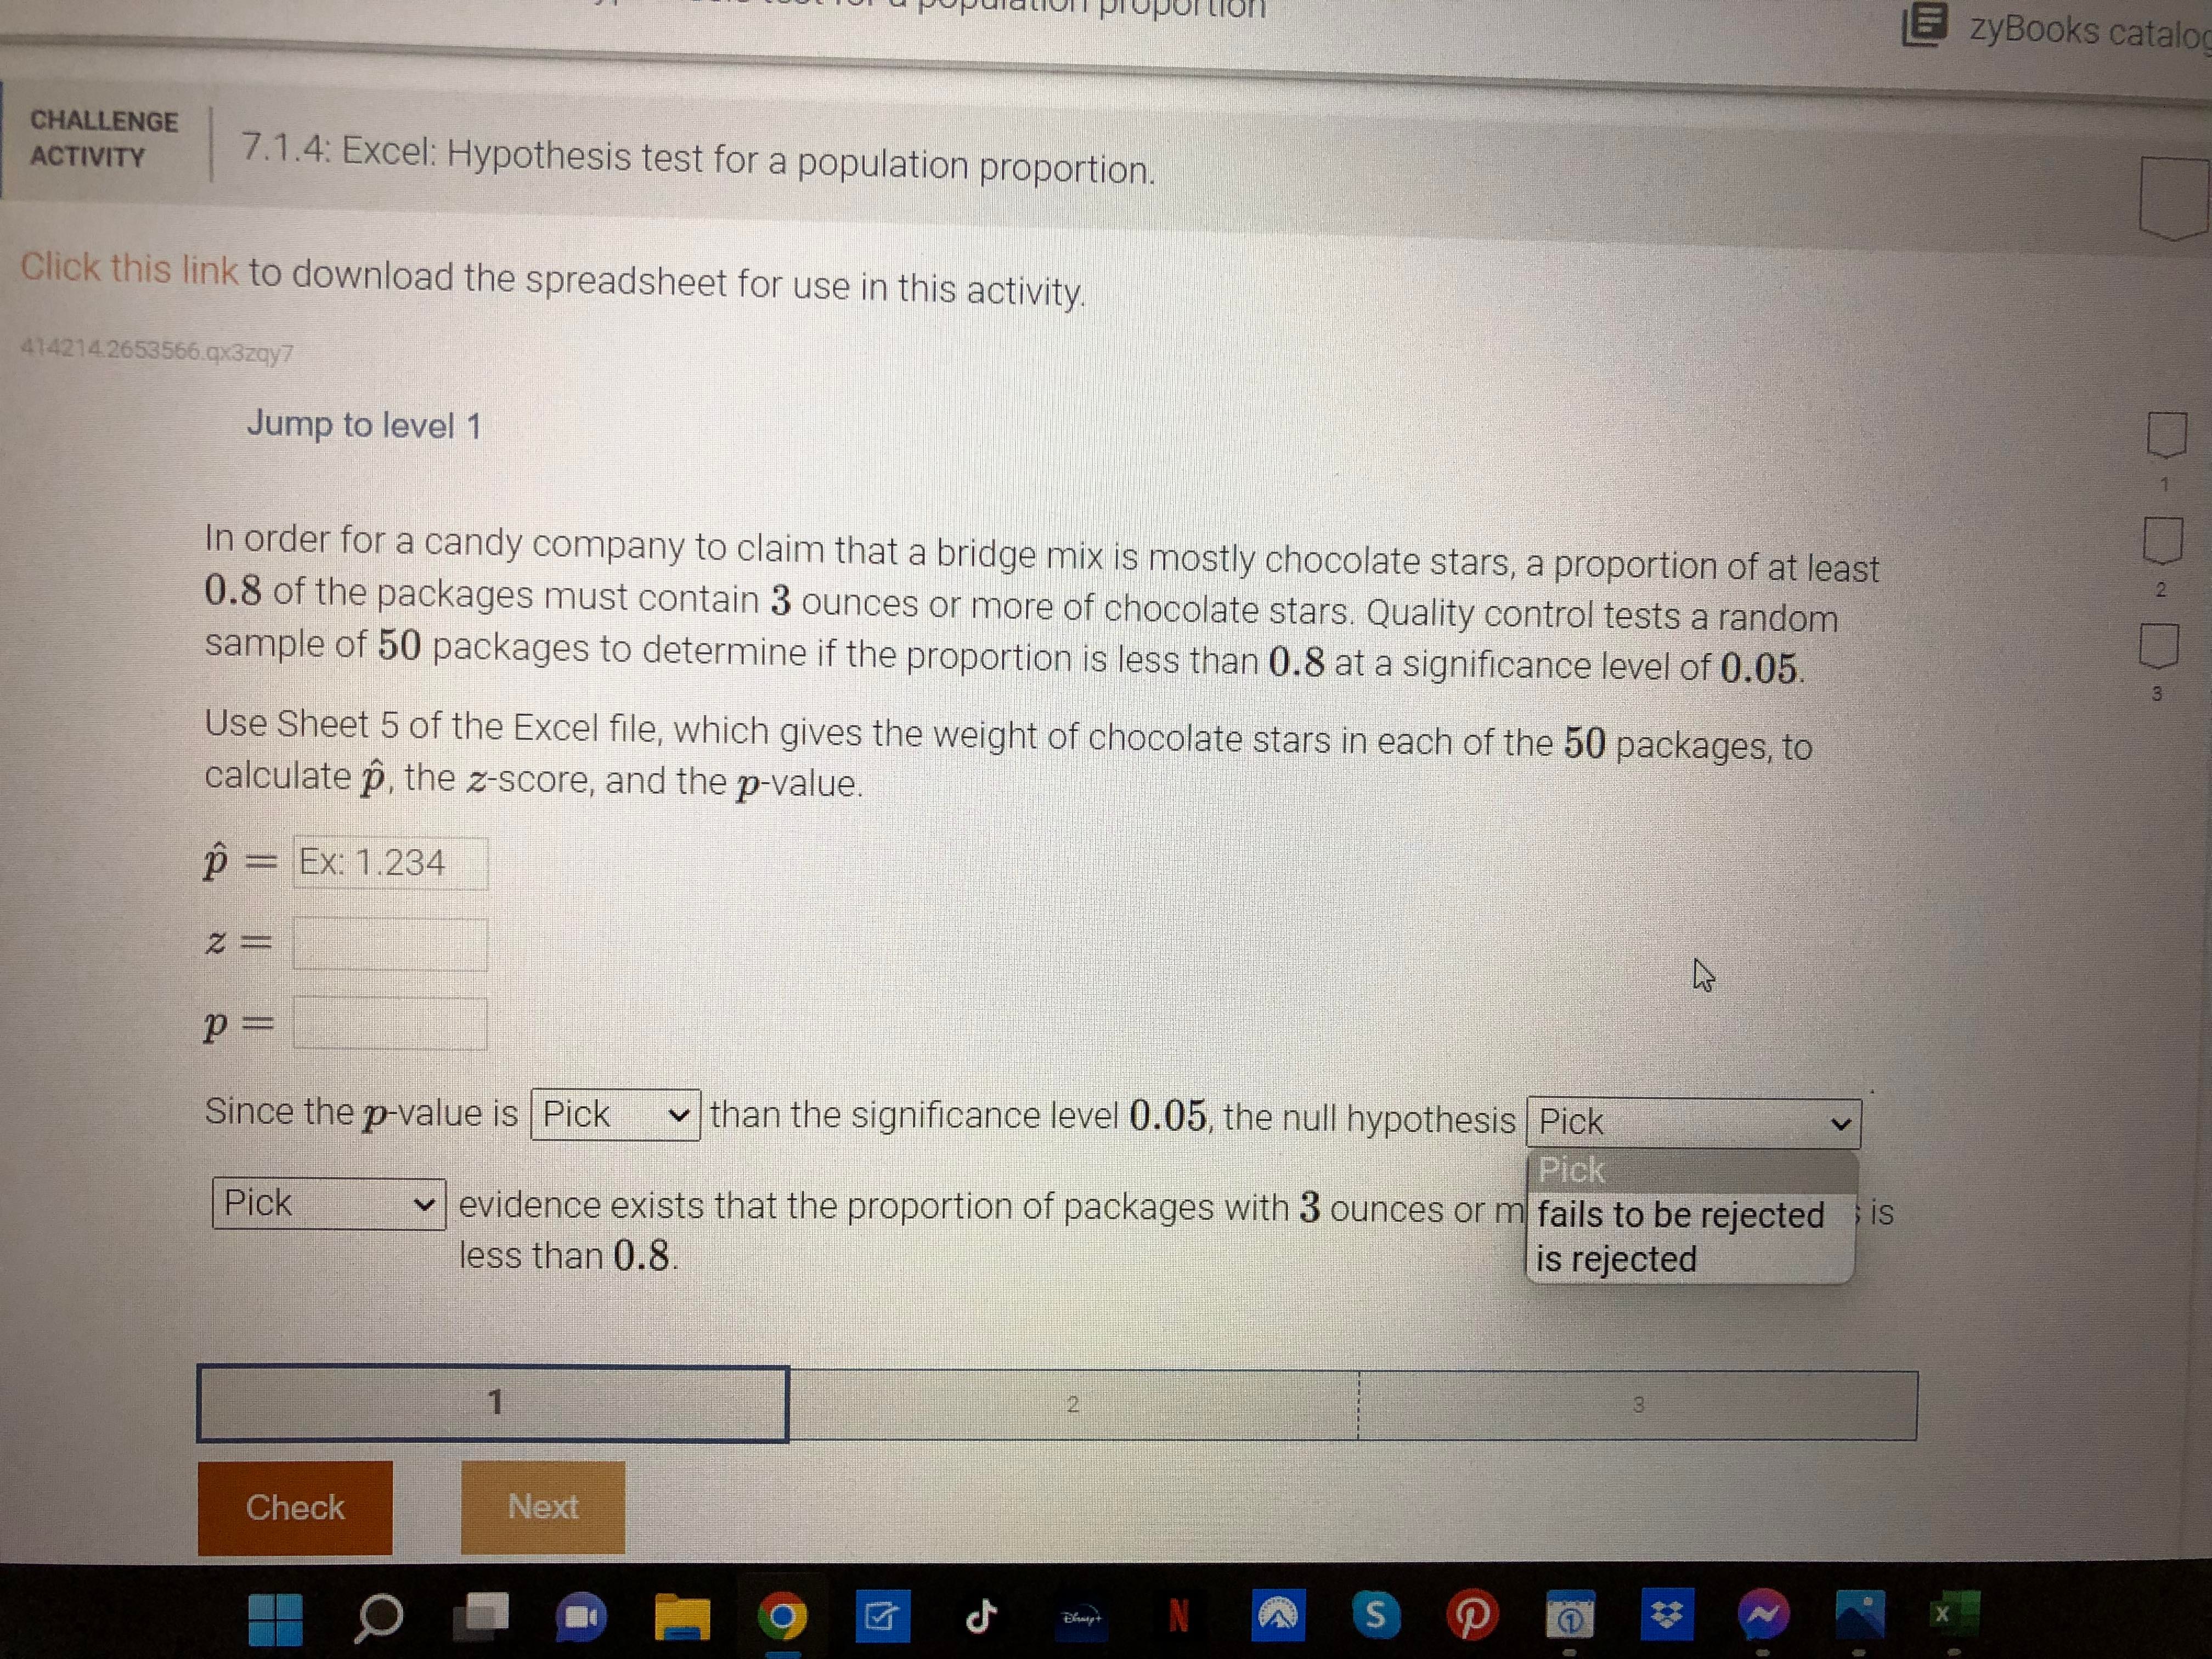
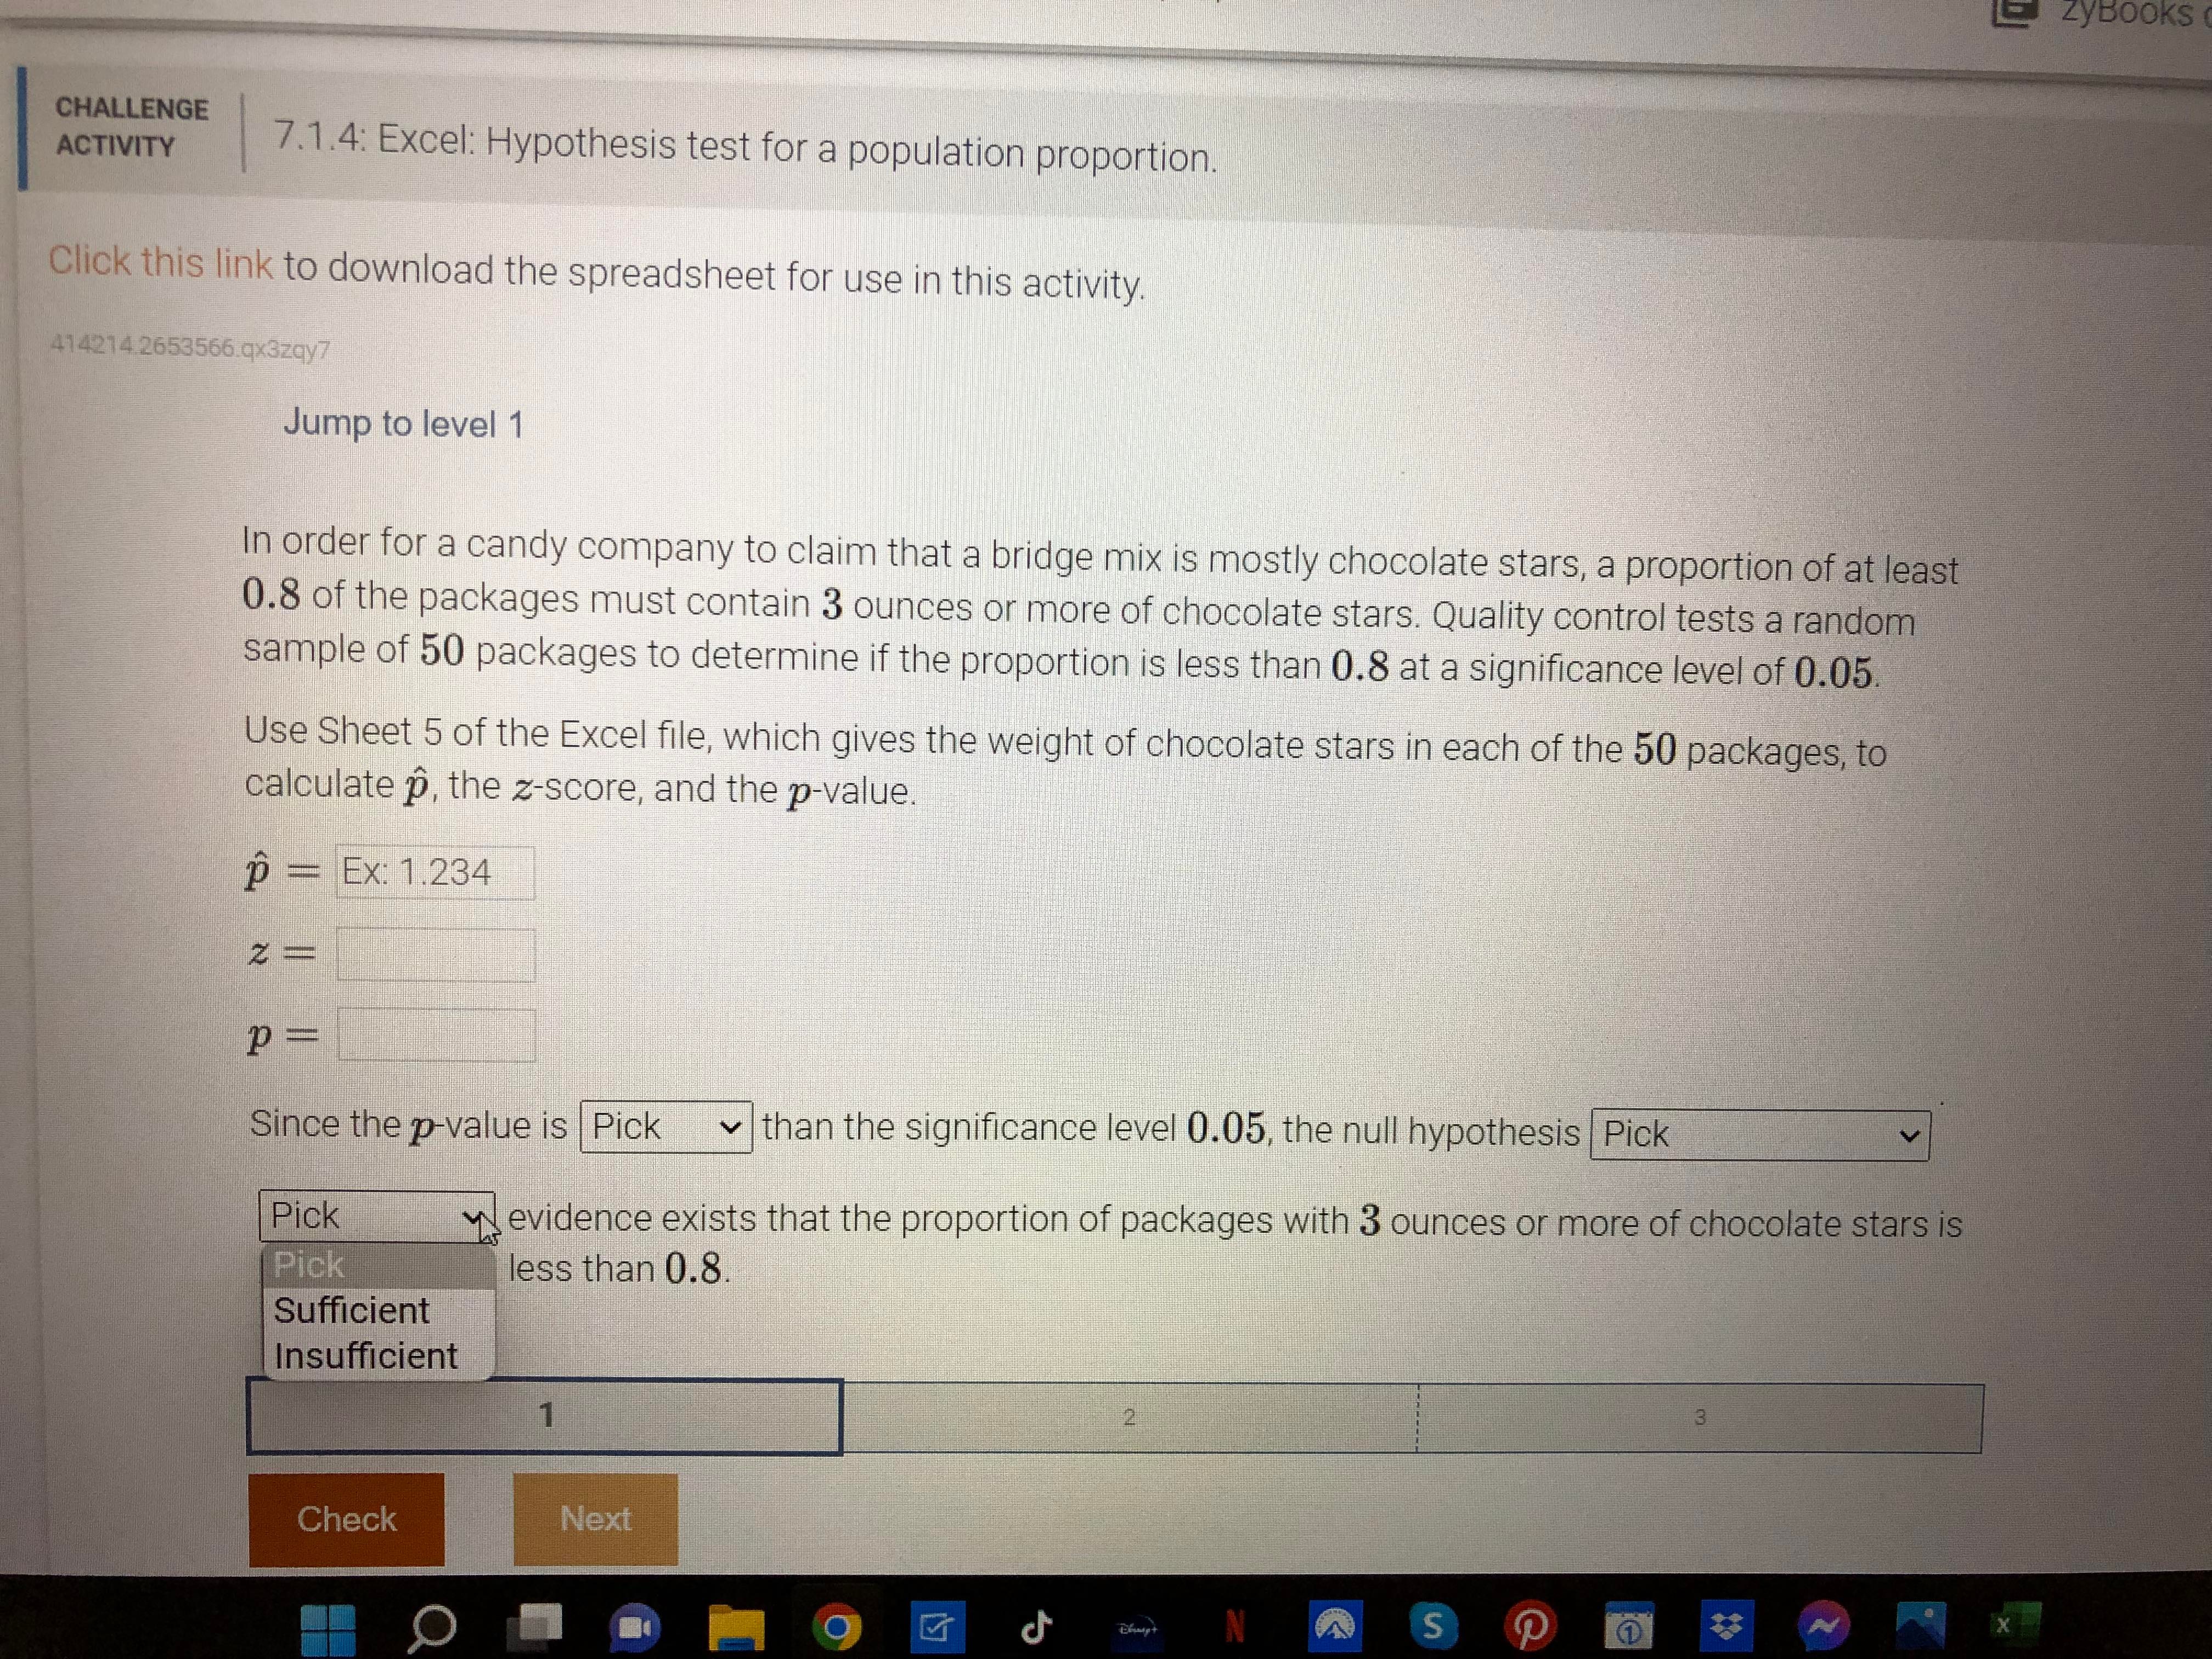
CHALLENGE ACTIVITY 7.1.4: Excel: Hypothesis test for a population proportion. Click this link to download the spreadsheet for use in this activity. 414214.2658566.qx3zay7 Start In order for a candy company to claim that a bridge mix is mostly chocolate stars, a proportion of at least 0.8 of the packages must contain 3 ounces or more of chocolate stars. Quality control tests a random sample of 50 packages to determine if the proportion is less than 0.8 at a significance level of 0.05. Use Sheet 5 of the Excel file, which gives the weight of chocolate stars in each of the 50 packages, to calculate p, the z-score, and the p-value. p = Ex: 1.234 Z = P = Since the p-value is Pick ~ than the significance level 0.05, the null hypothesis Pick Pick evidence exists that the proportion of packages with 3 ounces or more of chocolate stars is less than 0.8. Check Next O N S D NCHALLENGE ACTIVITY 7.1.4: Excel: Hypothesis test for a population proportion. Click this link to download the spreadsheet for use in this activity. 414214.2653566.qx3zay? Jump to level 1 In order for a candy company to claim that a bridge mix is mostly chocolate stars, a proportion of at least 0.8 of the packages must contain 3 ounces or more of chocolate stars. Quality control tests a random sample of 50 packages to determine if the proportion is less than 0.8 at a significance level of 0.05 Use Sheet 5 of the Excel file, which gives the weight of chocolate stars in each of the 50 packages, to calculate p, the z-score, and the p-value. p = Ex: 1.234 2 = p = Since the p-value is Pick |than the significance level 0.05, the null hypothesis | Pick Pick Pick evidegreater : that the proportion of packages with 3 ounces or more of chocolate stars is less less 3 Check Next O 9 N SzyBooks catalog CHALLENGE ACTIVITY 7.1.4: Excel: Hypothesis test for a population proportion. Click this link to download the spreadsheet for use in this activity. 414214 2653566.qx3zay7 Jump to level 1 In order for a candy company to claim that a bridge mix is mostly chocolate stars, a proportion of at least 2 0.8 of the packages must contain 3 ounces or more of chocolate stars. Quality control tests a random sample of 50 packages to determine if the proportion is less than 0.8 at a significance level of 0.05 Use Sheet 5 of the Excel file, which gives the weight of chocolate stars in each of the 50 packages, to calculate p, the z-score, and the p-value. p = Ex: 1.234 Z = p = Since the p-value is Pick ~ than the significance level 0.05, the null hypothesis| Pick Pick Pick evidence exists that the proportion of packages with 3 ounces or m fails to be rejected ; is less than 0.8. is rejected Check Next O O N S NZyBooks CHALLENGE ACTIVITY 7.1.4: Excel: Hypothesis test for a population proportion. Click this link to download the spreadsheet for use in this activity 414214 2653566.qx3zay7 Jump to level 1 In order for a candy company to claim that a bridge mix is mostly chocolate stars, a proportion of at least 0.8 of the packages must contain 3 ounces or more of chocolate stars. Quality control tests a random sample of 50 packages to determine if the proportion is less than 0.8 at a significance level of 0.05. Use Sheet 5 of the Excel file, which gives the weight of chocolate stars in each of the 50 packages, to calculate p, the z-score, and the p-value. p = Ex: 1.234 Z = p Since the p-value is Pick |than the significance level 0.05, the null hypothesis Pick Pick evidence exists that the proportion of packages with 3 ounces or more of chocolate stars is Pick less than 0.8. Sufficient Insufficient Check Next O O N A S N X
Step by Step Solution
There are 3 Steps involved in it

Get step-by-step solutions from verified subject matter experts