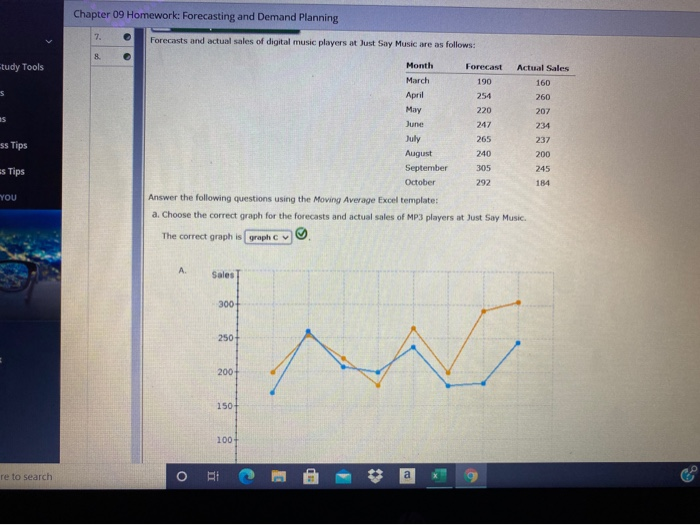
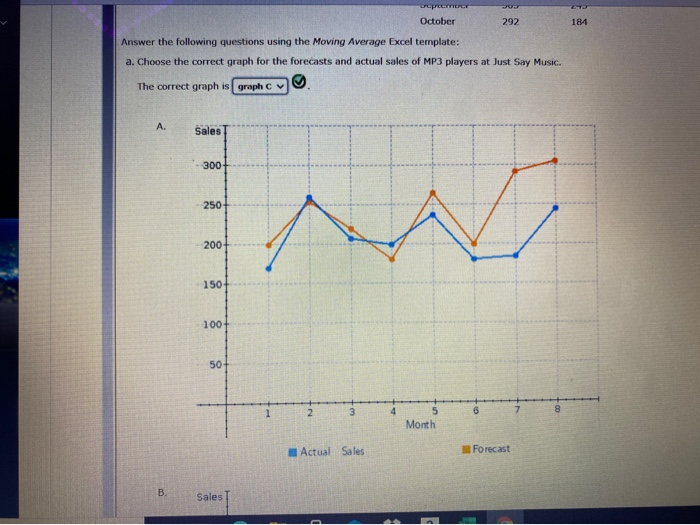
Question: Chapter 09 Homework: Forecasting and Demand Planning 7. Forecasts and actual sales of digital music players at Just Say Music are as follows: 8 tudy

Chapter 09 Homework: Forecasting and Demand
Chapter 09 Homework: Forecasting and Demand Planning 7. Forecasts and actual sales of digital music players at Just Say Music are as follows: 8 tudy Tools Forecast Actual Sales 190 160 s Month March April May June July August September October 254 220 247 es 260 207 234 237 200 265 ss Tips 240 s Tips 305 245 184 292 YOU Answer the following questions using the Moving Average Excel template: a. Choose the correct graph for the forecasts and actual sales of MP3 players at Just Say Music The correct graph is graph Cv A Sales 300 250+ N 200 150 1004 re to search O RI * a PIECE October 292 184 Answer the following questions using the Moving Average Excel template: a. Choose the correct graph for the forecasts and actual sales of MP3 players at Just Say Music. The correct graph is graph A. Sales - 300 250 w 200 150 100 50 1 3 4 6 8 N 5 Month Actual Sales Forecast B. Sales Actual Sales Forecast b. What is the forecast for November, using a two period moving average? Round your answer to two decimal places 10 c. What is the forecast for November, using a three-period moving average? Round your answer to two decimal places. d. Compute MSE for the two and three period moving average models and compare your results. Do not round intermediate calculations. Round your answers to two decimal places 2-period MA 3-period MA MSE The 2 period moving average is a better model. Hide Feedback Partially Correct Hint(s) Check My Work Olcon ko Problem 9-36 Algo (Statistical Forecasting Models) Question 6 of 8 Submit Assignment for Grading Save 7:52 PM 10/25/2020 o RI . desire File Home Insert Drawy Page Layout Formulas Data Review View Help O PROTECTED VIEW Beneful--les from the internet can contain vies Unless you need to edit, it's safe to stay in Protected View. Enable Editing B6 x fr 3 G H I M N P Moving Average Forecast N/A D E F 1 Moving Average Forecasting Cengage Learning 2 Not for commercial use. 3 4 Enter data only in yellow cells. The template is designed for up to 20 observations and ke 2, 3, or 4. 5. 6 Periods in moving average, k12.3.4 3 7 8 Time Period Observation Forecast Error Error2 1 172 0 2 217 3 190 N/A N/A 4 193.00 40.00 1600.00 5 179 213.33 34.33 1178.78 6 1621 200.67 38.67 1495.11 7 204 191.33 160.44 8 180 181.67 2.78 9 225 12.00 43.00 1849.00 10 250 203.00 2209.00 11 151 218,33 -67.33 4531.78 12 218 208.67 13 NN/A AN/A AN/A 14 AN/A N/A AN/A 15 IN/A IN/A #N/A 16 MN/A NN/A N/A 17 NN/A AN/A N/A 18 AN/A HN/A UN/A 19 IN/A WN/A AN/A 20 UN/A MN/A AN/A Next period forecast Time period: 13 206 33 MSE 1457,33 12.67 200 41.00 100 . T 11 12 13 14 15 16 17 18 Te Perd Moving Average Type here to search O I a

Step by Step Solution

There are 3 Steps involved in it

1 Expert Approved Answer
Step: 1 Unlock blur-text-image
Question Has Been Solved by an Expert!

Get step-by-step solutions from verified subject matter experts

Step: 2 Unlock
Step: 3 Unlock

Students Have Also Explored These Related General Management Questions!