

Question: CHAPTER 1: Introduction to Excel 2016 2. In your position as research assistant to a portfolio manager, you need to analyze the profitability of the
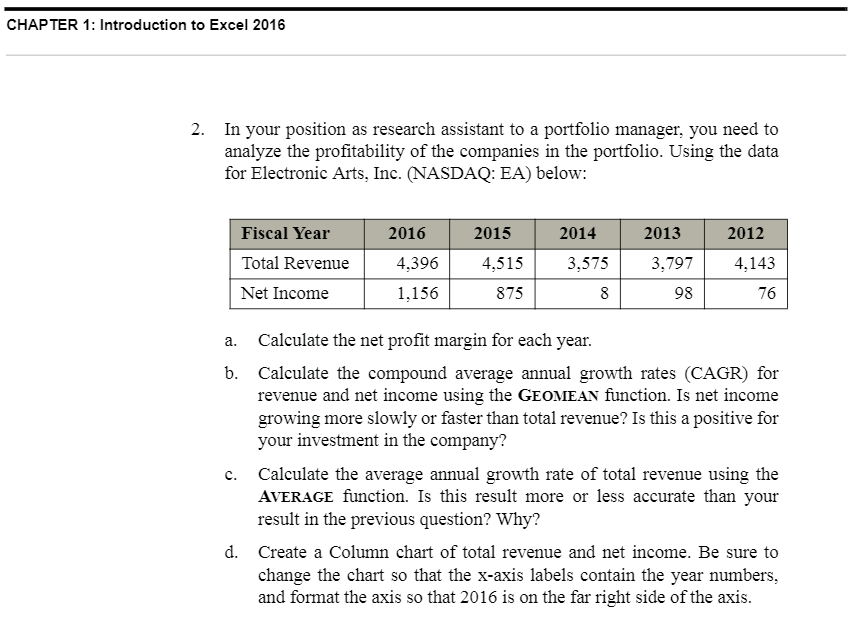
CHAPTER 1: Introduction to Excel 2016 2. In your position as research assistant to a portfolio manager, you need to analyze the profitability of the companies in the portfolio. Using the data for Electronic Arts, Inc. (NASDAQ: EA) below: 2016 2015 2014 2013 2012 Fiscal Year Total Revenue Net Income 3,797 4,143 4,396 1,156 4,515 875 3,575 8 98 76 a. Calculate the net profit margin for each year. b. Calculate the compound average annual growth rates (CAGR) for revenue and net income using the GEOMEAN function. Is net income growing more slowly or faster than total revenue? Is this a positive for your investment in the company? Calculate the average annual growth rate of total revenue using the AVERAGE function. Is this result more or less accurate than your result in the previous question? Why? d. Create a Column chart of total revenue and net income. Be sure to change the chart so that the x-axis labels contain the year numbers, and format the axis so that 2016 is on the far right side of the axis. c
Step by Step Solution
There are 3 Steps involved in it

Get step-by-step solutions from verified subject matter experts