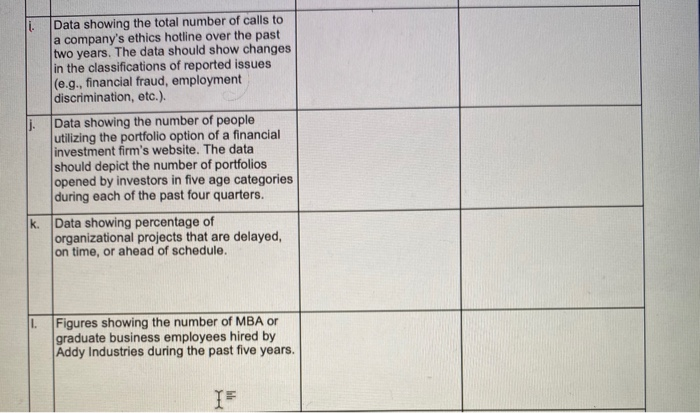
Question: Chapter 10, Managing Data and Using Graphics SELECTING APPROPRIATE GRAPHICS Select the most effective graphic means of presenting the following data. Justify your decision. Data

"Chapter 10, Managing Data and Using Graphics
"Chapter 10, Managing Data and Using Graphics SELECTING APPROPRIATE GRAPHICS Select the most effective graphic means of presenting the following data. Justify your decision. Data Type of Graphic Justification i Data showing the total number of calls to a company's ethics hotline over the past two years. The data should show changes in the classifications of reported issues (e.g., financial fraud, employment discrimination, etc.). Data showing the number of people utilizing the portfolio option of a financial investment firm's website. The data should depict the number of portfolios opened by investors in five age categories during each of the past four quarters. k. Data showing percentage of organizational projects that are delayed, on time, or ahead of schedule. 1. Figures showing the number of MBA or graduate business employees hired by Addy Industries during the past five years. IF

Step by Step Solution

There are 3 Steps involved in it

1 Expert Approved Answer
Step: 1 Unlock blur-text-image
Question Has Been Solved by an Expert!

Get step-by-step solutions from verified subject matter experts

Step: 2 Unlock
Step: 3 Unlock

Students Have Also Explored These Related General Management Questions!