

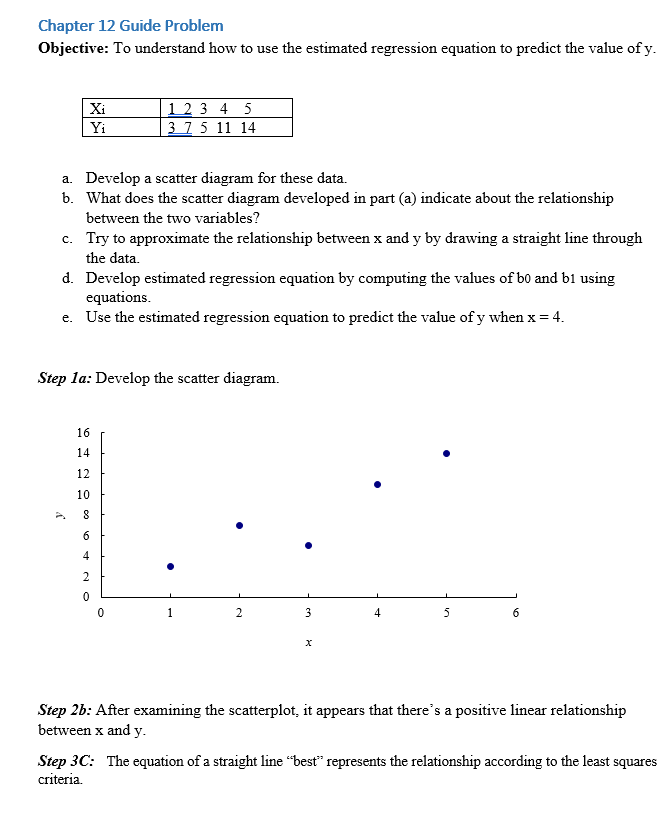
Question: Chapter 12 Guide Problem Objective: To understand how to use the estimated regression equation to predict the value of y. Xi 1 2 3 4

Chapter 12 Guide Problem
Objective: To understand how to use the estimated regression equation to predict the value of y.
| Xi | 1 2 3 4 5 |
| Yi | 3 7 5 11 14 |
- Develop a scatter diagram for these data.
- What does the scatter diagram developed in part (a) indicate about the relationship between the two variables?
- Try to approximate the relationship between x and y by drawing a straight line through the data.
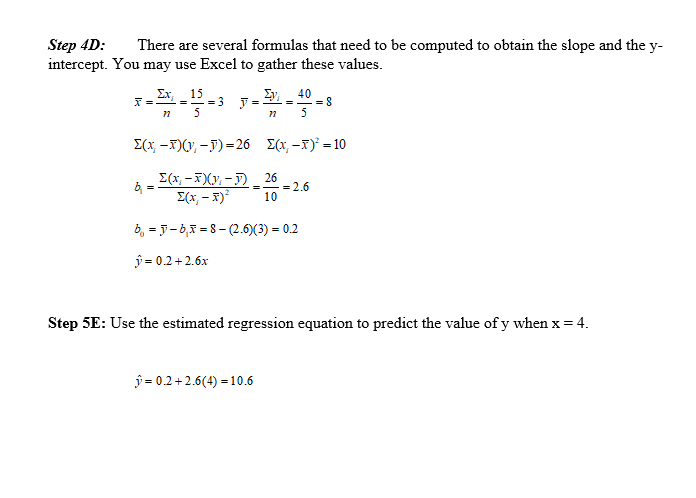
- Develop estimated regression equation by computing the values of b0 and b1 using equations.
- Use the estimated regression equation to predict the value of y when x = 4.
Step 1a: Develop the scatter diagram.
Step 2b: After examining the scatterplot, it appears that there's a positive linear relationship between x and y.
Step 3C: The equation of a straight line "best" represents the relationship according to the least squares criteria.
Step 4D: There are several formulas that need to be computed to obtain the slope and the y-intercept. You may use Excel to gather these values.
Step 5E:Use the estimated regression equation to predict the value of y when x = 4.
Chapter 12 Guide Problem Objective: To understand how to use the estimated regression equation to predict the value of 3;. _L23 4 5 a. Develop a scatter diagram for these data. b. What does the scatter diagram developed in part (a) indicate about the relationship between the two variables?I c. Try to approximate the relationship between x and 3r by drawing a straight hne through the data. d. Develop estimated regression equation by computing the values of hi} and bl using equations. e. Use the estimated regression equation to predict the value of 3r when x = 4. Step In: Develop the scatter diagram. 16 14 I 12 ll] SIM-FLUKE! Step 2.5: After examining the scatterplot, it appears that there's a positive linear relationship between K and 3'. Step 3C: The equation of a straight line \"best\" represents the relationship according to the least squares criteria
Step by Step Solution
There are 3 Steps involved in it

Get step-by-step solutions from verified subject matter experts