Question: Chapter 12 - Robust DOE, part 6, Injection Molding Complete this problem as indicated n slide 28 and select the best answer to the following:
Chapter 12 - Robust DOE, part 6, "Injection Molding"
Complete this problem as indicated n slide 28 and select the best answer to the following:
The strong factors using the 50% rule are: A. A, D, G B. B, C, G C. A, E, F D. A, D, F, G
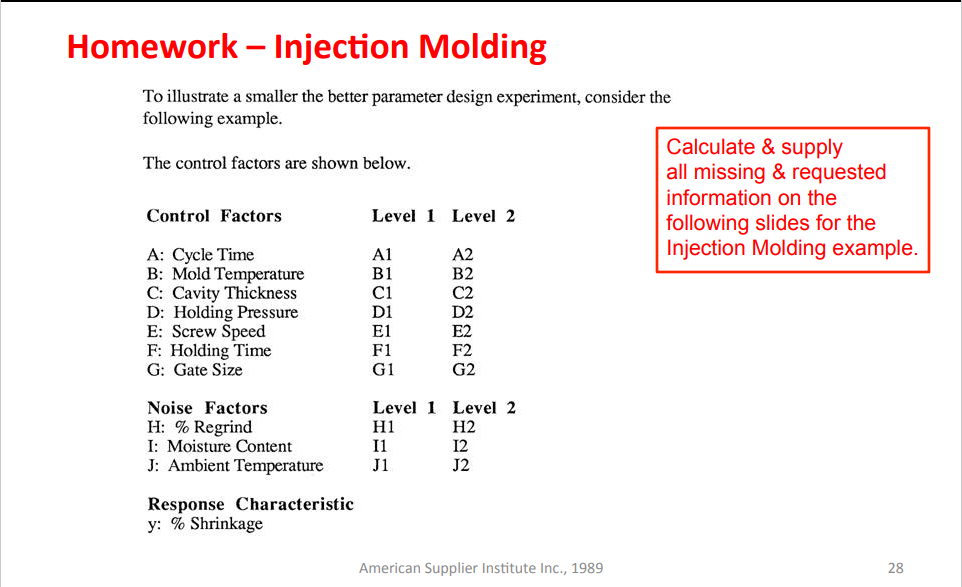
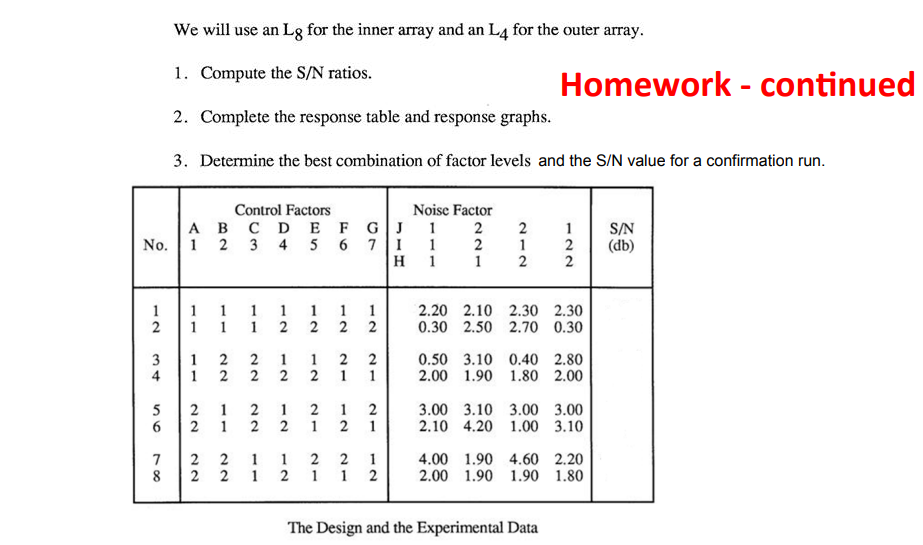
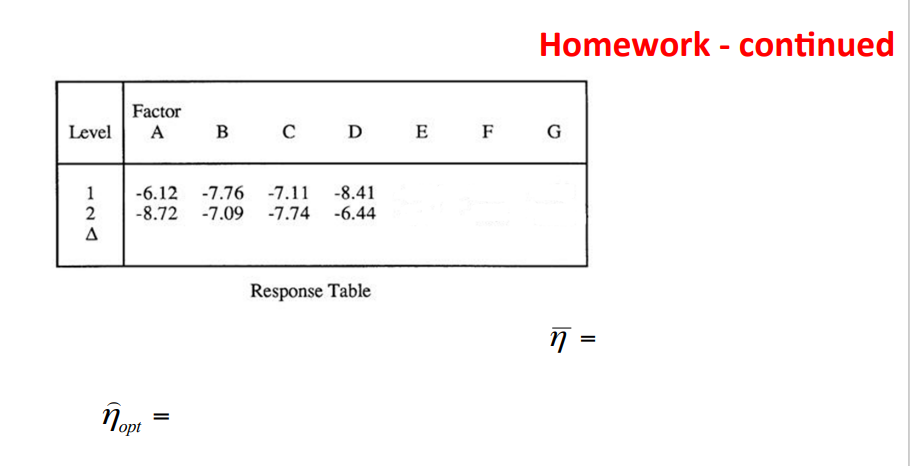
Homework Injection Molding To illustrate a smaller the better parameter design experiment, consider the following example. Calculate & supply The control factors are shown below. all missing & requested information on the Control Factors Level 1 Level 2 following slides for the A: Cycle Time A1 A2 Injection Molding example. B: Mold Temperature B1 C: Cavity Thickness D: Holding Pressure D1 E: Screw Speed F: Holding Time F1 G: Gate Size G1 G2 AdFFEE E1 D2 E2 F2 Noise Factors H: % Regrind I: Moisture Content J: Ambient Temperature Level 1 Level 2 H1 H2 11 12 J1 J2 fres Response Characteristic y: % Shrinkage American Supplier Institute Inc., 1989 28 We will use an Lg for the inner array and an L4 for the outer array. 1. Compute the S/N ratios. Homework - continued 2. Complete the response table and response graphs. 3. Determine the best combination of factor levels and the S/N value for a confirmation run. Control Factors Noise Factor A B C D E F G J 1 2 No. 1 2 3 4 5 6 7 I 1 2 H 1 1 2 1 2 1 2 2 S/N (db) 1 1 2 1 1 1 1 1 2 1 2 1 2 1 2 2.20 2.10 2.30 2.30 0.30 2.50 2.70 0.30 3 4 1 1 2 2 2 2 1 2 1 2 2 1 2 1 0.50 3.10 0.40 2.80 2.00 1.90 1.80 2.00 2 5 6 2 2 1 2 2 1 2 1 2 1 2 2 1 3.00 3.10 3.00 3.00 2.10 4.20 1.00 3.10 7 8 2 2 2 2 1 1 1 2 2 1 2 1 1 2 4.00 1.90 4.60 2.20 2.00 1.90 1.90 1.80 The Design and the Experimental Data Homework - continued Factor A Level B D E F G 1 2 -6.12 -7.76 -7.11 -8.72 -7.09 -7.74 -8.41 -6.44 Response Table n = = opt = Homework Injection Molding To illustrate a smaller the better parameter design experiment, consider the following example. Calculate & supply The control factors are shown below. all missing & requested information on the Control Factors Level 1 Level 2 following slides for the A: Cycle Time A1 A2 Injection Molding example. B: Mold Temperature B1 C: Cavity Thickness D: Holding Pressure D1 E: Screw Speed F: Holding Time F1 G: Gate Size G1 G2 AdFFEE E1 D2 E2 F2 Noise Factors H: % Regrind I: Moisture Content J: Ambient Temperature Level 1 Level 2 H1 H2 11 12 J1 J2 fres Response Characteristic y: % Shrinkage American Supplier Institute Inc., 1989 28 We will use an Lg for the inner array and an L4 for the outer array. 1. Compute the S/N ratios. Homework - continued 2. Complete the response table and response graphs. 3. Determine the best combination of factor levels and the S/N value for a confirmation run. Control Factors Noise Factor A B C D E F G J 1 2 No. 1 2 3 4 5 6 7 I 1 2 H 1 1 2 1 2 1 2 2 S/N (db) 1 1 2 1 1 1 1 1 2 1 2 1 2 1 2 2.20 2.10 2.30 2.30 0.30 2.50 2.70 0.30 3 4 1 1 2 2 2 2 1 2 1 2 2 1 2 1 0.50 3.10 0.40 2.80 2.00 1.90 1.80 2.00 2 5 6 2 2 1 2 2 1 2 1 2 1 2 2 1 3.00 3.10 3.00 3.00 2.10 4.20 1.00 3.10 7 8 2 2 2 2 1 1 1 2 2 1 2 1 1 2 4.00 1.90 4.60 2.20 2.00 1.90 1.90 1.80 The Design and the Experimental Data Homework - continued Factor A Level B D E F G 1 2 -6.12 -7.76 -7.11 -8.72 -7.09 -7.74 -8.41 -6.44 Response Table n = = opt =


