

Question: Chapter 13 Problems (1).pdf X C Get Homework Help With Cheg: x + ers/aaliy/Downloads/Chapter%2013%20Problems%20(1).pdf Maps PatchVantage Intro to IS: Drawing Join a Meeting - Zo
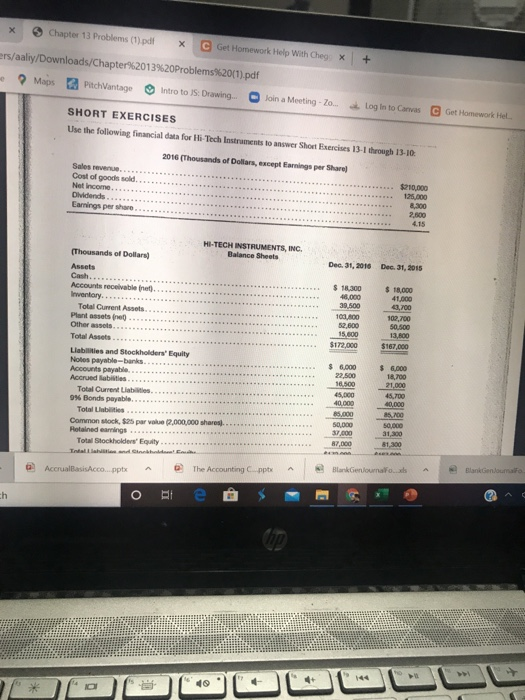
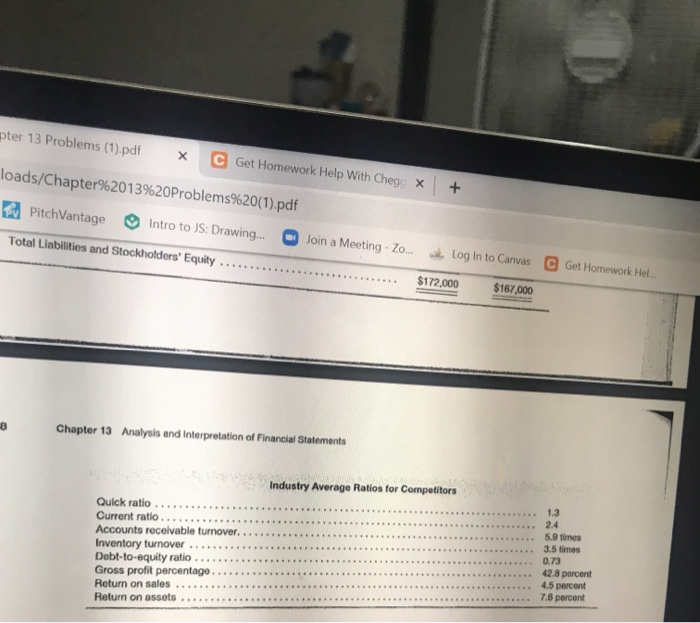
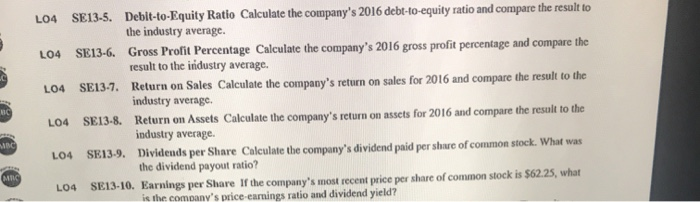
Chapter 13 Problems (1).pdf X C Get Homework Help With Cheg: x + ers/aaliy/Downloads/Chapter%2013%20Problems%20(1).pdf Maps PatchVantage Intro to IS: Drawing Join a Meeting - Zo Log in to Canvas C Get Homework Hel SHORT EXERCISES Use the following financial data for Hi-Tech Instruments to answer Short Exercises 13-1 through 13-10: 2016 (Thousands of Dollars, except Earnings per Share Sales rever $210,000 Cost of goods sold 125,000 Not Income Dividends Earnings per share 8,300 2,600 4.15 Dec 31, 2016 Dec 31, 2015 $18.000 41,000 3,700 $ 1.300 48.000 39.500 100,00 52.000 15,600 $172,000 100,700 HI-TECH INSTRUMENTS, INC. (Thousands of Dollars Balance Sheets Assets Cash.... Accounts receivable et Inventory Total Current Assets Plant assets Other assets Total Assets Liabilities and Stockholders' Equity Notes payable-banks Accounts payable Accrued abilities Total Current Liabilities 0% Bonds payable Total Liabilities Common stock, $25 par value 2,000,000 shares Retained earnings Total Stockholders' Equity Total and Chat AccrualBasisAcco...pptx The Accounting Cpptx 50,500 13,800 $187.000 $ 6,000 22,500 16.500 45,000 40.000 85.000 50,000 37.000 87,000 $ 6,000 18,700 21,000 45.700 40,000 85.00 50.000 31.300 81,300 BlankGenjournalfo. Blankenduma O th RI Q pter 13 Problems (1).pdf C Get Homework Help With Chegex loads/Chapter%2013%20Problems%20(1).pdf + Bu PitchVantage Intro to JS: Drawing... Total Liabilities and Stockholders' Equity Join a Meeting - Zo... Log in to Canvas C Get Homework Hel $172,000 $167,000 Chapter 13 Analysis and Interpretation of Financial Statements Industry Average Ratios for Competitors Quick ratio Current ratio Accounts receivable turnover, Inventory turnover Debt-to-equity ratio Gross profit percentago Return on sales Return on ossets 1.3 2.4 5.9 times 3.5 times 0.73 42.8 percent 4.5 percent 7.8 percent *** ********** LO4 LO4 LO4 uc SE13-5. Debit-to-Equity Ratio Calculate the company's 2016 debt-to-equity ratio and compare the result to the industry average. SE13-6. Gross Profit Percentage Calculate the company's 2016 gross profit percentage and compare the result to the industry average. SE13-7. Return on Sales Calculate the company's return on sales for 2016 and compare the result to the industry average SE13-8. Return on Assets Calculate the company's return on assets for 2016 and compare the result to the industry average. SE13-9. Dividends per Share Calculate the company's dividend paid per share of common stock. What was the dividend payout ratio? SE13-10. Earnings per Share of the company's most recent price per share of common stock is $62.25, what is the company's price earnings ratio and dividend yield? LO4 LO4 LO4 Chapter 13 Problems (1).pdf X C Get Homework Help With Cheg: x + ers/aaliy/Downloads/Chapter%2013%20Problems%20(1).pdf Maps PatchVantage Intro to IS: Drawing Join a Meeting - Zo Log in to Canvas C Get Homework Hel SHORT EXERCISES Use the following financial data for Hi-Tech Instruments to answer Short Exercises 13-1 through 13-10: 2016 (Thousands of Dollars, except Earnings per Share Sales rever $210,000 Cost of goods sold 125,000 Not Income Dividends Earnings per share 8,300 2,600 4.15 Dec 31, 2016 Dec 31, 2015 $18.000 41,000 3,700 $ 1.300 48.000 39.500 100,00 52.000 15,600 $172,000 100,700 HI-TECH INSTRUMENTS, INC. (Thousands of Dollars Balance Sheets Assets Cash.... Accounts receivable et Inventory Total Current Assets Plant assets Other assets Total Assets Liabilities and Stockholders' Equity Notes payable-banks Accounts payable Accrued abilities Total Current Liabilities 0% Bonds payable Total Liabilities Common stock, $25 par value 2,000,000 shares Retained earnings Total Stockholders' Equity Total and Chat AccrualBasisAcco...pptx The Accounting Cpptx 50,500 13,800 $187.000 $ 6,000 22,500 16.500 45,000 40.000 85.000 50,000 37.000 87,000 $ 6,000 18,700 21,000 45.700 40,000 85.00 50.000 31.300 81,300 BlankGenjournalfo. Blankenduma O th RI Q pter 13 Problems (1).pdf C Get Homework Help With Chegex loads/Chapter%2013%20Problems%20(1).pdf + Bu PitchVantage Intro to JS: Drawing... Total Liabilities and Stockholders' Equity Join a Meeting - Zo... Log in to Canvas C Get Homework Hel $172,000 $167,000 Chapter 13 Analysis and Interpretation of Financial Statements Industry Average Ratios for Competitors Quick ratio Current ratio Accounts receivable turnover, Inventory turnover Debt-to-equity ratio Gross profit percentago Return on sales Return on ossets 1.3 2.4 5.9 times 3.5 times 0.73 42.8 percent 4.5 percent 7.8 percent *** ********** LO4 LO4 LO4 uc SE13-5. Debit-to-Equity Ratio Calculate the company's 2016 debt-to-equity ratio and compare the result to the industry average. SE13-6. Gross Profit Percentage Calculate the company's 2016 gross profit percentage and compare the result to the industry average. SE13-7. Return on Sales Calculate the company's return on sales for 2016 and compare the result to the industry average SE13-8. Return on Assets Calculate the company's return on assets for 2016 and compare the result to the industry average. SE13-9. Dividends per Share Calculate the company's dividend paid per share of common stock. What was the dividend payout ratio? SE13-10. Earnings per Share of the company's most recent price per share of common stock is $62.25, what is the company's price earnings ratio and dividend yield? LO4 LO4 LO4
Step by Step Solution
There are 3 Steps involved in it

Get step-by-step solutions from verified subject matter experts