

Question: Question #1 (Using average and standard deviation of annual returns, 15 points): Fill in your answers in the blanks for each of the empty yellow
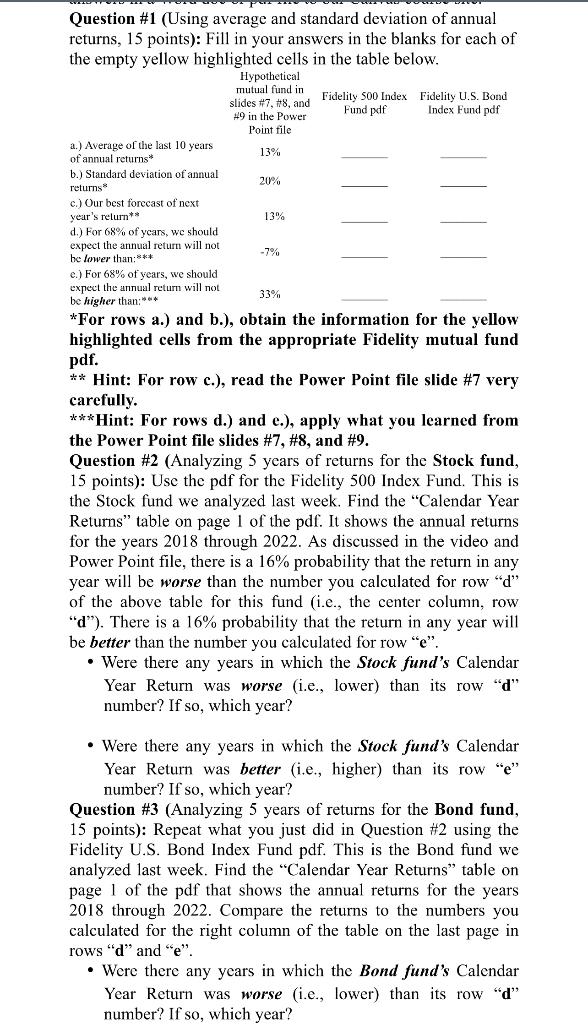
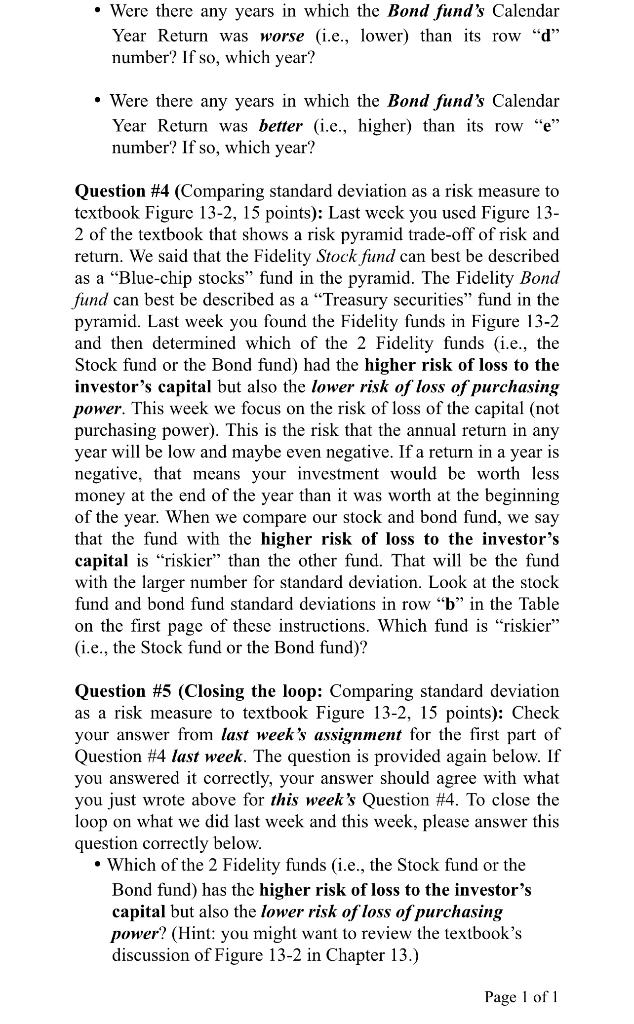
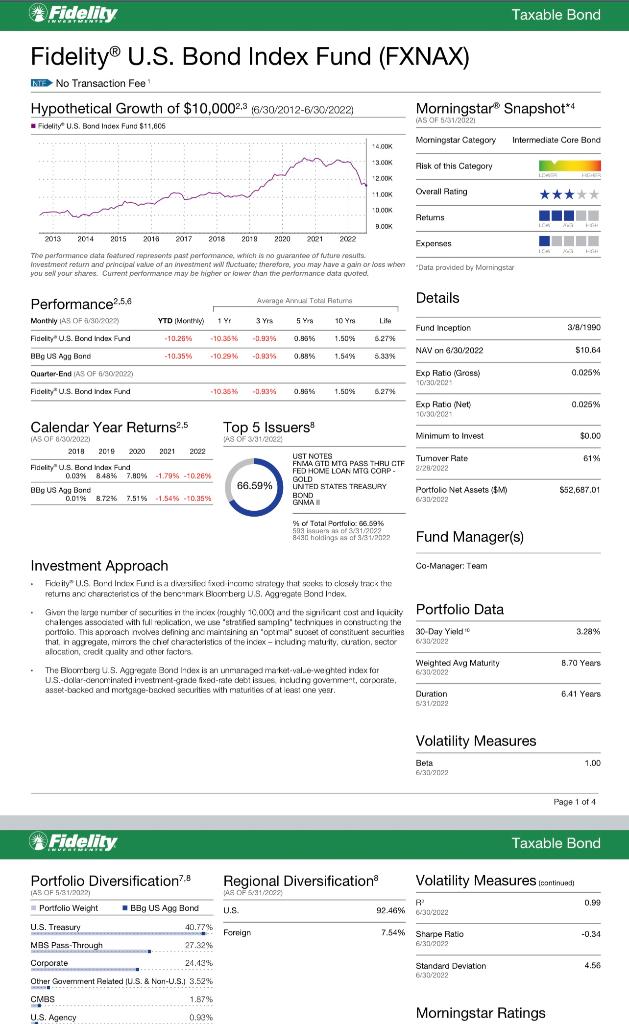
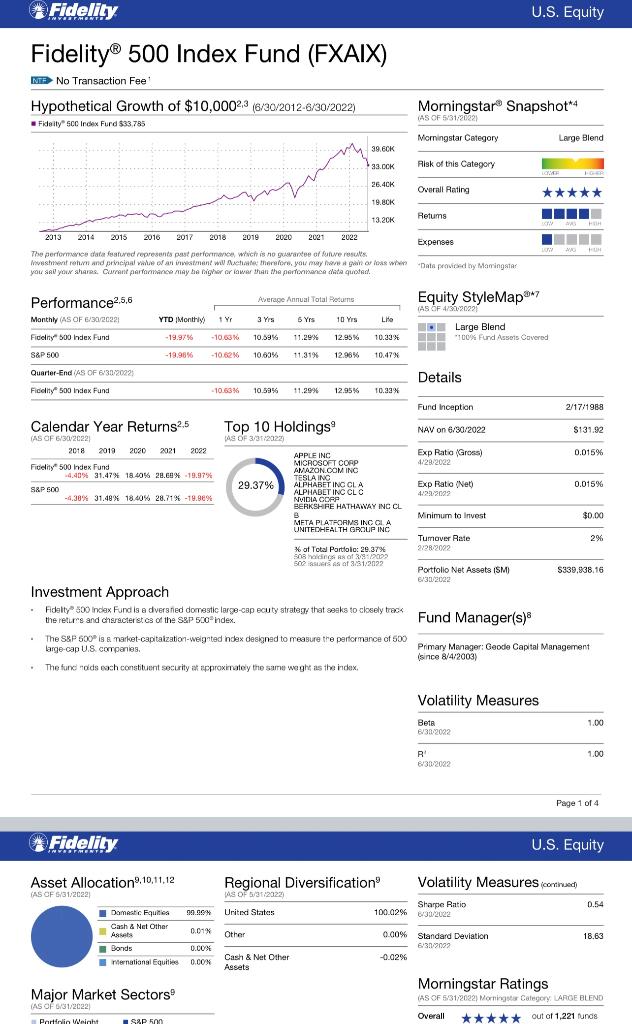
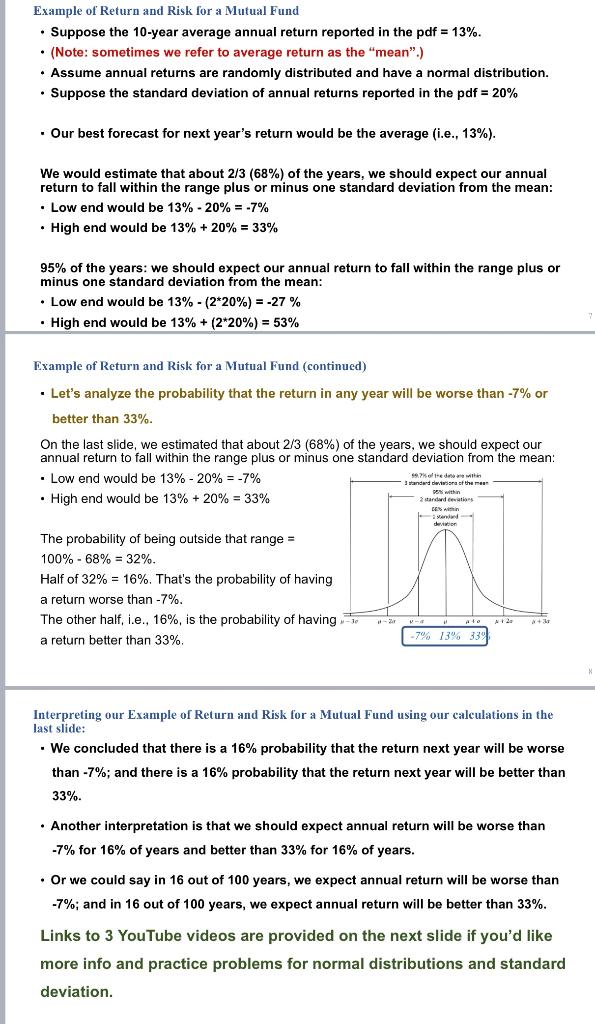
Question \#1 (Using average and standard deviation of annual returns, 15 points): Fill in your answers in the blanks for each of the empty yellow highlighted cells in the table below. * For rows a.) and b.), obtain the information for the yellow highlighted cells from the appropriate Fidelity mutual fund pdf. Hint: For row c.), read the Power Point file slide \#7 very carefully. Hint: For rows d.) and e.), apply what you learned from the Power Point file slides \#7, \#8, and \#9. Question \#2 (Analyzing 5 years of returns for the Stock fund, 15 points): Use the pdf for the Fidelity 500 Index Fund. This is the Stock fund we analyzed last week. Find the "Calendar Year Returns" table on page 1 of the pdf. It shows the annual returns for the years 2018 through 2022 . As discussed in the video and Power Point file, there is a 16% probability that the return in any year will be worse than the number you calculated for row " d " of the above table for this fund (i.e., the center column, row " d "). There is a 16% probability that the return in any year will be better than the number you calculated for row "e". - Were there any years in which the Stock fund's Calendar Year Return was worse (i.e., lower) than its row "d" number? If so, which year? - Were there any years in which the Stock fund's Calendar Year Return was better (i.e., higher) than its row "e" number? If so, which year? Question \#3 (Analyzing 5 years of returns for the Bond fund, 15 points): Repeat what you just did in Question #2 using the Fidelity U.S. Bond Index Fund pdf. This is the Bond fund we analyzed last week. Find the "Calendar Year Returns" table on page 1 of the pdf that shows the annual returns for the years 2018 through 2022 . Compare the returns to the numbers you calculated for the right column of the table on the last page in rows " d " and "e". - Were there any years in which the Bond fund's Calendar Year Return was worse (i.e., lower) than its row "d" - Were there any years in which the Bond fund's Calendar Year Return was worse (i.e., lower) than its row "d" number? If so, which year? - Were there any years in which the Bond fund's Calendar Year Return was better (i.e., higher) than its row "e" number? If so, which year? Question \#4 (Comparing standard deviation as a risk measure to textbook Figure 13-2, 15 points): Last weck you used Figure 132 of the textbook that shows a risk pyramid trade-off of risk and return. We said that the Fidelity Stock fund can best be described as a "Blue-chip stocks" fund in the pyramid. The Fidelity Bond fund can best be described as a "Treasury securities" fund in the pyramid. Last week you found the Fidelity funds in Figure 13-2 and then determined which of the 2 Fidelity funds (i.e., the Stock fund or the Bond fund) had the higher risk of loss to the investor's capital but also the lower risk of loss of purchasing power. This week we focus on the risk of loss of the capital (not purchasing power). This is the risk that the annual return in any year will be low and maybe even negative. If a return in a year is negative, that means your investment would be worth less money at the end of the year than it was worth at the beginning that the fund with the higher risk of loss to the investor's capital is "riskier" than the other fund. That will be the fund capital is "riskier" than the other fund. That will be the fund fund and bond fund standard deviations in row "b" in the Table on the first page of these instructions. Which fund is "riskier" (i.e., the Stock fund or the Bond fund)? Question \#5 (Closing the loop: Comparing standard deviation as a risk measure to textbook Figure 13-2, 15 points): Check your answer from last week's assignment for the first part of Question \#4 last week. The question is provided again below. If you answered it correctly, your answer should agree with what you just wrote above for this week's Question \#4. To close the loop on what we did last week and this week, please answer this question correctly below. - Which of the 2 Fidelity funds (i.e., the Stock fund or the Bond fund) has the higher risk of loss to the investor's capital but also the lower risk of loss of purchasing power? (Hint: you might want to review the textbook's discussion of Figure 13-2 in Chapter 13.) Page 1 of 1 Fidelity U.S. Bond Index Fund (FXNAX) No Transaction Fee 1 Hypothetical Growth of $10,0002,3(6/30/20126/30/2022) - Fidelity ,3. Band lndex Fund $11,605 Tho parfarmance data foduwed represchts past performance, which is no guarantes of future osatte. ifivestment retum and principal value of an investment mW Auctuate; therotare, you may have a gain ar ioss when you sell your shares. Current pertormance may be higher or iower than the periormance data quoted. Volatility Measures Fidely Taxable Bond Fidelity 500 Index Fund (FXAIX) No Transaction Fee Hypothetical Growth of $10,0002,3(6/30/20126/30/2022) - Fideity 5cc. Irdexx Furd $33,785 The periormence data fyafured copresents past perionmance, which is no gotarantes of future results. you sab you shares. Carrant partomance may be fighor or iawar than the pertormanca dida quotad. - The fund roids each constituent security a efproxitnstey the same waght as the index, Page 1 of 4 Example of Return and Risk for a Mutual Fund - Suppose the 10-year average annual return reported in the pdf =13%. - (Note: sometimes we refer to average return as the "mean".) - Assume annual returns are randomly distributed and have a normal distribution. - Suppose the standard deviation of annual returns reported in the pdf =20% - Our best forecast for next year's return would be the average (i.e., 13\%). We would estimate that about 2/3(68%) of the years, we should expect our annual return to fall within the range plus or minus one standard deviation from the mean: - Low end would be 13%20%=7% - High end would be 13%+20%=33% 95% of the years: we should expect our annual return to fall within the range plus or minus one standard deviation from the mean: - Low end would be 13%(220%)=27% - High end would be 13%+(220%)=53% Example of Return and Risk for a Mutual Fund (continued) - Let's analyze the probability that the return in any year will be worse than 7% or better than 33%. On the last slide, we estimated that about 2/3(68%) of the years, we should expect our annual return to fall within the range plus or minus one standard deviation from the mean: - Low end would be 13%20%=7% - High end would be 13%+20%=33% The probability of being outside that range = 100%68%=32%. Half of 32%=16%. That's the probability of having a return worse than 7%. The other half, i.e., 16%, is the probability of having a return better than 33%. Interpreting our Example of Return and Risk for a Mutual Fund using our calculations in the last slide: - We concluded that there is a 16% probability that the return next year will be worse than 7%; and there is a 16% probability that the return next year will be better than 33%. - Another interpretation is that we should expect annual return will be worse than 7% for 16% of years and better than 33% for 16% of years. - Or we could say in 16 out of 100 years, we expect annual return will be worse than 7%; and in 16 out of 100 years, we expect annual return will be better than 33%. Links to 3 YouTube videos are provided on the next slide if you'd like more info and practice problems for normal distributions and standard deviation. Question \#1 (Using average and standard deviation of annual returns, 15 points): Fill in your answers in the blanks for each of the empty yellow highlighted cells in the table below. * For rows a.) and b.), obtain the information for the yellow highlighted cells from the appropriate Fidelity mutual fund pdf. Hint: For row c.), read the Power Point file slide \#7 very carefully. Hint: For rows d.) and e.), apply what you learned from the Power Point file slides \#7, \#8, and \#9. Question \#2 (Analyzing 5 years of returns for the Stock fund, 15 points): Use the pdf for the Fidelity 500 Index Fund. This is the Stock fund we analyzed last week. Find the "Calendar Year Returns" table on page 1 of the pdf. It shows the annual returns for the years 2018 through 2022 . As discussed in the video and Power Point file, there is a 16% probability that the return in any year will be worse than the number you calculated for row " d " of the above table for this fund (i.e., the center column, row " d "). There is a 16% probability that the return in any year will be better than the number you calculated for row "e". - Were there any years in which the Stock fund's Calendar Year Return was worse (i.e., lower) than its row "d" number? If so, which year? - Were there any years in which the Stock fund's Calendar Year Return was better (i.e., higher) than its row "e" number? If so, which year? Question \#3 (Analyzing 5 years of returns for the Bond fund, 15 points): Repeat what you just did in Question #2 using the Fidelity U.S. Bond Index Fund pdf. This is the Bond fund we analyzed last week. Find the "Calendar Year Returns" table on page 1 of the pdf that shows the annual returns for the years 2018 through 2022 . Compare the returns to the numbers you calculated for the right column of the table on the last page in rows " d " and "e". - Were there any years in which the Bond fund's Calendar Year Return was worse (i.e., lower) than its row "d" - Were there any years in which the Bond fund's Calendar Year Return was worse (i.e., lower) than its row "d" number? If so, which year? - Were there any years in which the Bond fund's Calendar Year Return was better (i.e., higher) than its row "e" number? If so, which year? Question \#4 (Comparing standard deviation as a risk measure to textbook Figure 13-2, 15 points): Last weck you used Figure 132 of the textbook that shows a risk pyramid trade-off of risk and return. We said that the Fidelity Stock fund can best be described as a "Blue-chip stocks" fund in the pyramid. The Fidelity Bond fund can best be described as a "Treasury securities" fund in the pyramid. Last week you found the Fidelity funds in Figure 13-2 and then determined which of the 2 Fidelity funds (i.e., the Stock fund or the Bond fund) had the higher risk of loss to the investor's capital but also the lower risk of loss of purchasing power. This week we focus on the risk of loss of the capital (not purchasing power). This is the risk that the annual return in any year will be low and maybe even negative. If a return in a year is negative, that means your investment would be worth less money at the end of the year than it was worth at the beginning that the fund with the higher risk of loss to the investor's capital is "riskier" than the other fund. That will be the fund capital is "riskier" than the other fund. That will be the fund fund and bond fund standard deviations in row "b" in the Table on the first page of these instructions. Which fund is "riskier" (i.e., the Stock fund or the Bond fund)? Question \#5 (Closing the loop: Comparing standard deviation as a risk measure to textbook Figure 13-2, 15 points): Check your answer from last week's assignment for the first part of Question \#4 last week. The question is provided again below. If you answered it correctly, your answer should agree with what you just wrote above for this week's Question \#4. To close the loop on what we did last week and this week, please answer this question correctly below. - Which of the 2 Fidelity funds (i.e., the Stock fund or the Bond fund) has the higher risk of loss to the investor's capital but also the lower risk of loss of purchasing power? (Hint: you might want to review the textbook's discussion of Figure 13-2 in Chapter 13.) Page 1 of 1 Fidelity U.S. Bond Index Fund (FXNAX) No Transaction Fee 1 Hypothetical Growth of $10,0002,3(6/30/20126/30/2022) - Fidelity ,3. Band lndex Fund $11,605 Tho parfarmance data foduwed represchts past performance, which is no guarantes of future osatte. ifivestment retum and principal value of an investment mW Auctuate; therotare, you may have a gain ar ioss when you sell your shares. Current pertormance may be higher or iower than the periormance data quoted. Volatility Measures Fidely Taxable Bond Fidelity 500 Index Fund (FXAIX) No Transaction Fee Hypothetical Growth of $10,0002,3(6/30/20126/30/2022) - Fideity 5cc. Irdexx Furd $33,785 The periormence data fyafured copresents past perionmance, which is no gotarantes of future results. you sab you shares. Carrant partomance may be fighor or iawar than the pertormanca dida quotad. - The fund roids each constituent security a efproxitnstey the same waght as the index, Page 1 of 4 Example of Return and Risk for a Mutual Fund - Suppose the 10-year average annual return reported in the pdf =13%. - (Note: sometimes we refer to average return as the "mean".) - Assume annual returns are randomly distributed and have a normal distribution. - Suppose the standard deviation of annual returns reported in the pdf =20% - Our best forecast for next year's return would be the average (i.e., 13\%). We would estimate that about 2/3(68%) of the years, we should expect our annual return to fall within the range plus or minus one standard deviation from the mean: - Low end would be 13%20%=7% - High end would be 13%+20%=33% 95% of the years: we should expect our annual return to fall within the range plus or minus one standard deviation from the mean: - Low end would be 13%(220%)=27% - High end would be 13%+(220%)=53% Example of Return and Risk for a Mutual Fund (continued) - Let's analyze the probability that the return in any year will be worse than 7% or better than 33%. On the last slide, we estimated that about 2/3(68%) of the years, we should expect our annual return to fall within the range plus or minus one standard deviation from the mean: - Low end would be 13%20%=7% - High end would be 13%+20%=33% The probability of being outside that range = 100%68%=32%. Half of 32%=16%. That's the probability of having a return worse than 7%. The other half, i.e., 16%, is the probability of having a return better than 33%. Interpreting our Example of Return and Risk for a Mutual Fund using our calculations in the last slide: - We concluded that there is a 16% probability that the return next year will be worse than 7%; and there is a 16% probability that the return next year will be better than 33%. - Another interpretation is that we should expect annual return will be worse than 7% for 16% of years and better than 33% for 16% of years. - Or we could say in 16 out of 100 years, we expect annual return will be worse than 7%; and in 16 out of 100 years, we expect annual return will be better than 33%. Links to 3 YouTube videos are provided on the next slide if you'd like more info and practice problems for normal distributions and standard deviation
Step by Step Solution
There are 3 Steps involved in it

Get step-by-step solutions from verified subject matter experts