

Question: Chapter 14 Capital Structure and Leverage 467 FIGURE 14.2 Mustration of Operating Leverage Plan A Revenues and Costs (Thousands of Dollars) 240 Sales Revenues Operating
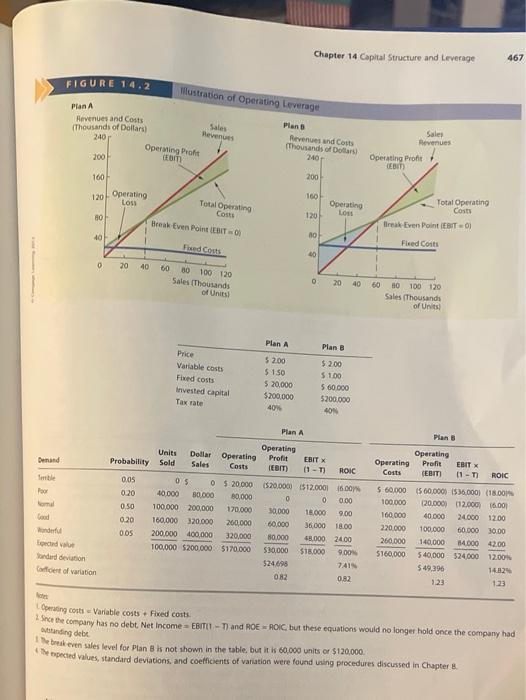
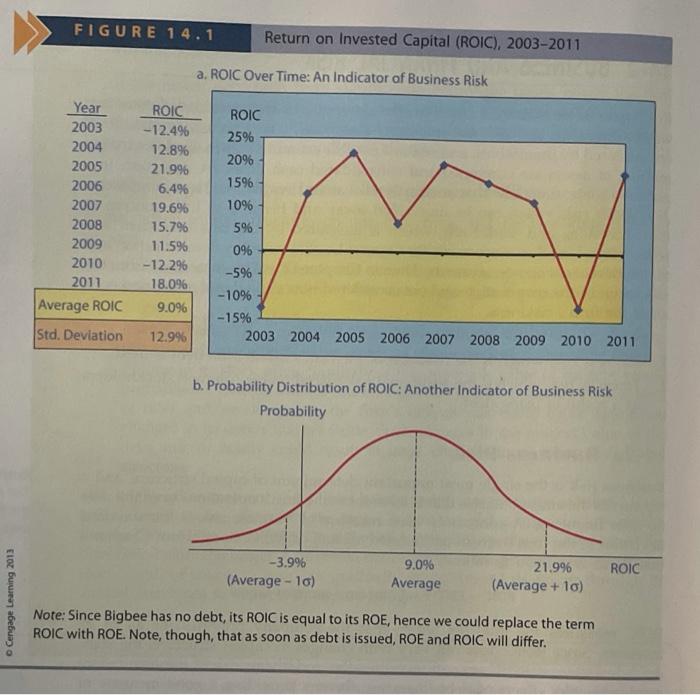
Chapter 14 Capital Structure and Leverage 467 FIGURE 14.2 Mustration of Operating Leverage Plan A Revenues and Costs (Thousands of Dollars) 240 Sales Revenues Operating Profit COM Plans Revenged Costs (Thousands of Dollar 240 Sales Revenues Operating Profit DEBIT 200 160 200 120 Operating 160 Loss 2 Operating Total Operating Cost Break Even Point (EDIT 80 120 Total Operating Costs Il-Even Point EBIT-01 40 10 Fed Costs Fleed Costs 40 0 20 40 60 0 100 120 Sales Thousands of Units 0 20 40 60 HO 100 120 Sales (Thousands of Units Plan A Plan B Price Variable costs Fixed costs Invested capital Tax rate 52.00 $150 $ 20,000 $200.000 409 $2.00 $ 100 500.000 5200.000 40 Plan A Plan Units Demand Probability Sold Dollar Operating Sales Costs Poor mal 0.05 0.20 0.50 05 0 $ 20.000 40.000 90.000 0.000 100.000 200.000 170.000 160,000 320,000 260,000 200.000 400,000 320,000 100,000 $200,000 $170.000 Operating Profit EBIT X (EBIT) 01-T) ROIC 1520,000 12.000 18.00 0 0 000 30,000 18.000 9.00 60,000 36000 18.00 80,000 48.000 24.00 530,000 $18.000 9.00 $24.698 7AN 082 0.82 0.20 Operating Operating Profit EBIT x Costs (EBIT) 11 - ROIC $ 60,000 $60,000 1536.000) (18.00 100.000 (20.000 12.000 6.00 160.000 40.000 24.000 12.00 220.000 100.000 60.000 30.00 260.000 140.000 14.000 42.00 5160,000 540.000 524.000 12.00% 549.306 1482 3.23 133 0.05 Epected value Sandalen et ovation Operating costs Variable costs Fred costs 2 Shce the company has no debt, Net Income - EBIT-T) and ROE - ROIC but these equations would no longer hold once the company had standing debt Iebrik even sales tevel for Plan 8 ks not shown in the table, but it 60,000 units or $120,000 httpected values, standard deviations, and coefficients of variation were found using procedures discussed in Chapter 8 FIGURE 14.1 Return on invested Capital (ROIC), 2003-2011 a. ROIC Over Time: An Indicator of Business Risk Year 2003 2004 2005 2006 2007 2008 2009 2010 2011 Average ROIC ROIC -12.496 12.8% 21.9% 6.4% 19.6% 15.796 11.5% -12.296 18.096 ROIC 25% 20% 1596 10% 5% 096 -5% -10% -15% 2003 2004 2005 2006 2007 2008 2009 2010 2011 9.096 Std. Deviation 12.9% b. Probability Distribution of ROIC: Another Indicator of Business Risk Probability -3.996 (Average-10) ROIC 9.0% Average 21.996 (Average +10) Cengage Learning 2013 Note: Since Bigbee has no debt, its ROIC is equal to its ROE, hence we could replace the term ROIC with ROE. Note, though, that as soon as debt is issued, ROE and ROIC will differ. Chapter 14 Capital Structure and Leverage 467 FIGURE 14.2 Mustration of Operating Leverage Plan A Revenues and Costs (Thousands of Dollars) 240 Sales Revenues Operating Profit COM Plans Revenged Costs (Thousands of Dollar 240 Sales Revenues Operating Profit DEBIT 200 160 200 120 Operating 160 Loss 2 Operating Total Operating Cost Break Even Point (EDIT 80 120 Total Operating Costs Il-Even Point EBIT-01 40 10 Fed Costs Fleed Costs 40 0 20 40 60 0 100 120 Sales Thousands of Units 0 20 40 60 HO 100 120 Sales (Thousands of Units Plan A Plan B Price Variable costs Fixed costs Invested capital Tax rate 52.00 $150 $ 20,000 $200.000 409 $2.00 $ 100 500.000 5200.000 40 Plan A Plan Units Demand Probability Sold Dollar Operating Sales Costs Poor mal 0.05 0.20 0.50 05 0 $ 20.000 40.000 90.000 0.000 100.000 200.000 170.000 160,000 320,000 260,000 200.000 400,000 320,000 100,000 $200,000 $170.000 Operating Profit EBIT X (EBIT) 01-T) ROIC 1520,000 12.000 18.00 0 0 000 30,000 18.000 9.00 60,000 36000 18.00 80,000 48.000 24.00 530,000 $18.000 9.00 $24.698 7AN 082 0.82 0.20 Operating Operating Profit EBIT x Costs (EBIT) 11 - ROIC $ 60,000 $60,000 1536.000) (18.00 100.000 (20.000 12.000 6.00 160.000 40.000 24.000 12.00 220.000 100.000 60.000 30.00 260.000 140.000 14.000 42.00 5160,000 540.000 524.000 12.00% 549.306 1482 3.23 133 0.05 Epected value Sandalen et ovation Operating costs Variable costs Fred costs 2 Shce the company has no debt, Net Income - EBIT-T) and ROE - ROIC but these equations would no longer hold once the company had standing debt Iebrik even sales tevel for Plan 8 ks not shown in the table, but it 60,000 units or $120,000 httpected values, standard deviations, and coefficients of variation were found using procedures discussed in Chapter 8 FIGURE 14.1 Return on invested Capital (ROIC), 2003-2011 a. ROIC Over Time: An Indicator of Business Risk Year 2003 2004 2005 2006 2007 2008 2009 2010 2011 Average ROIC ROIC -12.496 12.8% 21.9% 6.4% 19.6% 15.796 11.5% -12.296 18.096 ROIC 25% 20% 1596 10% 5% 096 -5% -10% -15% 2003 2004 2005 2006 2007 2008 2009 2010 2011 9.096 Std. Deviation 12.9% b. Probability Distribution of ROIC: Another Indicator of Business Risk Probability -3.996 (Average-10) ROIC 9.0% Average 21.996 (Average +10) Cengage Learning 2013 Note: Since Bigbee has no debt, its ROIC is equal to its ROE, hence we could replace the term ROIC with ROE. Note, though, that as soon as debt is issued, ROE and ROIC will differ
Step by Step Solution
There are 3 Steps involved in it

Get step-by-step solutions from verified subject matter experts