

Question: Chapter 15 Q1 See attachments d) Does the coefficient of Catch/Trap mean that when the catch per trap declines the prices will increase? O A.
Chapter 15 Q1 See attachments
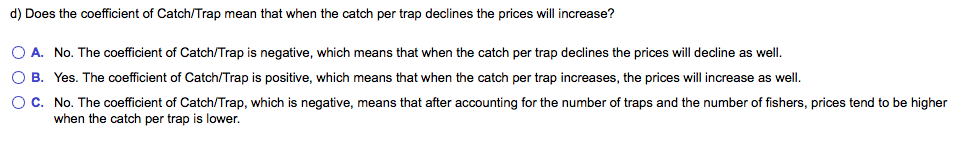
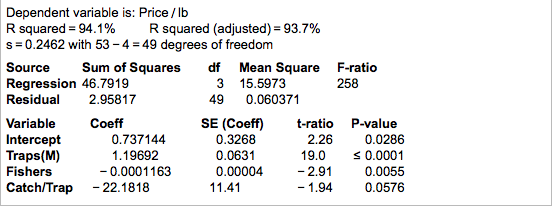
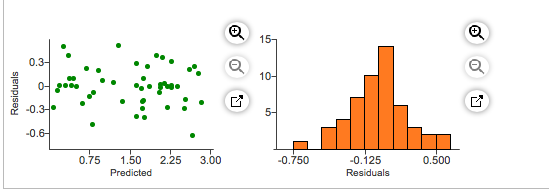
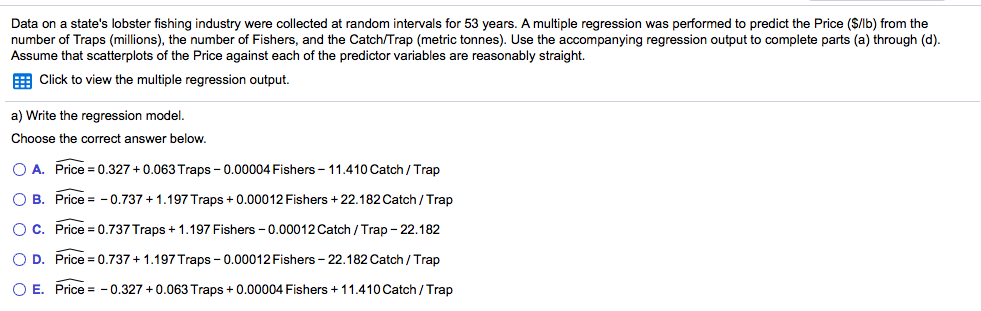
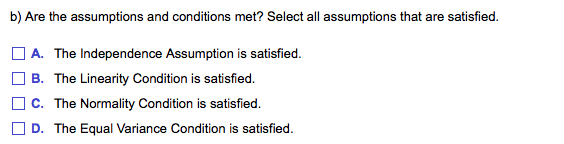
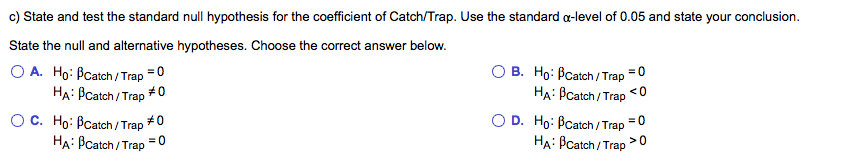
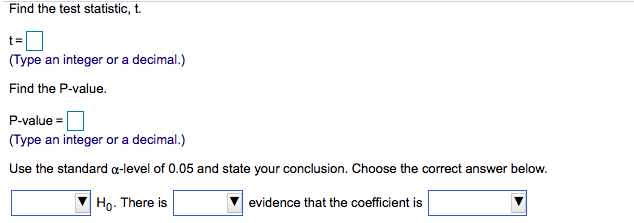
d) Does the coefficient of Catch/Trap mean that when the catch per trap declines the prices will increase? O A. No. The coefficient of Catch/Trap is negative, which means that when the catch per trap declines the prices will decline as well. O B. Yes. The coefficient of Catch/Trap is positive, which means that when the catch per trap increases, the prices will increase as well. O C. No. The coefficient of Catch/Trap, which is negative, means that after accounting for the number of traps and the number of fishers, prices tend to be higher when the catch per trap is lower.Dependent variable is: Price / lb R squared = 94.1% R squared (adjusted) = 93.7% s = 0.2462 with 53 - 4 = 49 degrees of freedom Source Sum of Squares df Mean Square F-ratio Regression 46.7919 3 15.5973 258 Residual 2.95817 49 0.060371 Variable Coeff SE (Coeff) t-ratio P-value Intercept 0.737144 0.3268 2.26 0.0286 Traps (M) 1.19692 0.0631 19.0 $ 0.0001 Fishers - 0.0001163 0.00004 - 2.91 0.0055 Catch/Trap - 22.1818 11.41 - 1.94 0.0576\fData on a state's lobster fishing industry were collected at random intervals for 53 years. A multiple regression was performed to predict the Price ($/Ib) from the number of Traps (millions), the number of Fishers, and the Catch/Trap (metric tonnes). Use the accompanying regression output to complete parts (a) through (d). Assume that scatterplots of the Price against each of the predictor variables are reasonably straight. Click to view the multiple regression output. a) Write the regression model. Choose the correct answer below. O A. Price = 0.327 + 0.063 Traps - 0.00004 Fishers - 11.410 Catch / Trap O B. Price = - 0.737 + 1.197 Traps + 0.00012 Fishers + 22.182 Catch / Trap O C. Price = 0.737 Traps + 1.197 Fishers - 0.00012 Catch / Trap - 22.182 O D. Price = 0.737 + 1.197 Traps -0.00012 Fishers - 22.182 Catch / Trap O E. Price = - 0.327 + 0.063 Traps + 0.00004 Fishers + 11.410 Catch / Trapb) Are the assumptions and conditions met? Select all assumptions that are satisfied. A. The Independence Assumption is satisfied. B. The Linearity Condition is satisfied. C. The Normality Condition is satisfied. D. The Equal Variance Condition is satisfied.c) State and test the standard null hypothesis for the coefficient of Catch/Trap. Use the standard o-level of 0.05 and state your conclusion. State the null and alternative hypotheses. Choose the correct answer below. O A. Ho: Pcatch / Trap = 0 O B. Ho: Pcatch / Trap = 0 HA: Pcatch/ Trap #0 HA: Pcatch / Trap 0Find the test statistic, t. (Type an integer or a decimal.) Find the P-value. P-value = (Type an integer or a decimal.) Use the standard o-level of 0.05 and state your conclusion. Choose the correct answer below. Ho. There is evidence that the coefficient is
Step by Step Solution
There are 3 Steps involved in it

Get step-by-step solutions from verified subject matter experts